Solution Found!
Failure times of silicon wafer microchips. Researchers
Chapter 12, Problem 63E(choose chapter or problem)
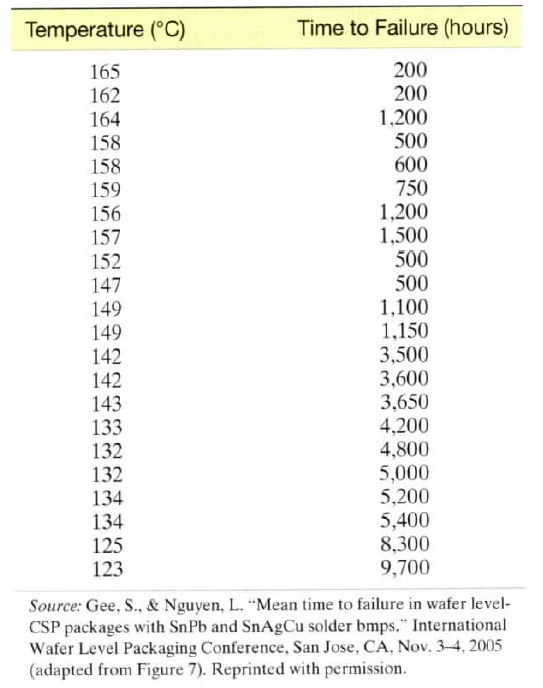
Failure times of silicon wafer microchips. Researchers atNational Semiconductor experimented with tin-lead solder bumps used to manufacture silicon wafer integrated circuit chips (International Wafer Level Packaging Conference,Nov. 3–4, 2005). The failure times of the microchips(in hours) was determined at different solder temperatures(degrees Celsius). The data for one experiment are given in the table. The researchers want to predict failure time (y)based on solder temperature (x).
a. Construct a scatterplot for the data. What type of relationship, linear or curvilinear, appears to exist between failure time and solder temperature?
b. Fit the model, \(E(y)=\beta_0+\beta_1x+\beta_2x^2\), to the data.Give the least squares prediction equation.
c. Conduct a test to determine if there is upward curvature in the relationship between failure time and solder temperature. (Use \(\alpha\ =\ .05\).)
Questions & Answers
QUESTION:
Failure times of silicon wafer microchips. Researchers atNational Semiconductor experimented with tin-lead solder bumps used to manufacture silicon wafer integrated circuit chips (International Wafer Level Packaging Conference,Nov. 3–4, 2005). The failure times of the microchips(in hours) was determined at different solder temperatures(degrees Celsius). The data for one experiment are given in the table. The researchers want to predict failure time (y)based on solder temperature (x).
a. Construct a scatterplot for the data. What type of relationship, linear or curvilinear, appears to exist between failure time and solder temperature?
b. Fit the model, \(E(y)=\beta_0+\beta_1x+\beta_2x^2\), to the data.Give the least squares prediction equation.
c. Conduct a test to determine if there is upward curvature in the relationship between failure time and solder temperature. (Use \(\alpha\ =\ .05\).)
ANSWER:
Step 1 of 3
It is given that the study of tin-lead solder bumps used to manufacture silicon wafer
integrated circuit chips. The failure times of the microchips (in hours) were determined at
different solder temperatures (degrees Celsius).
The table gives the data for failure times and solder’s temperature

(a) We have to construct a scatter plot for failure times and solder’s temperature
The researcher wants to predict failure time (y) based on solder temperature (x)

The scatter diagram shows that the relation exists between failure times and solder’s temperature is curvilinear. The data is in decreasing trend and curvilinear nature.