Solution Found!
Identify the problem(s) in each of the residual plotsshown
Chapter 12, Problem 120E(choose chapter or problem)
Identify the problem(s) in each of the residual plot shown below.
Questions & Answers
QUESTION:
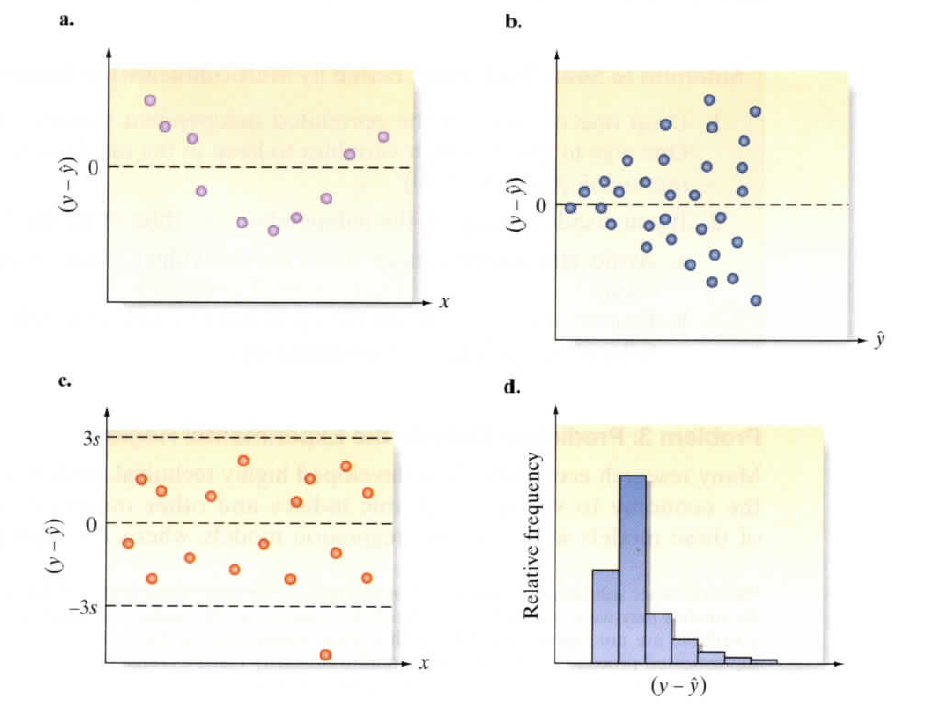
Identify the problem(s) in each of the residual plot shown below.
ANSWER:
Step 1 of 4
a) By observing residual plot for the straight-line model reveals a nonrandom
pattern. The residuals exhibit a curved shape, with the residuals for the small
values of x above the horizontal 0 (mean of the residual) line, the residuals
corresponding to the middle values of x below the 0 line, and the residuals for the
largest values of x again above the 0 line. The indication is that the mean value of
the random error 
be equal to 0. Such a pattern usually indicates that curvature needs to be added to
the model.