Solution Found!
Detecting gender-related employment disparities. In the
Chapter 13, Problem 12E(choose chapter or problem)
Detecting gender-related employment disparities. In the Federal Reserve Bank of Atlanta, Working Paper Series (Oct. 2008), researchers presented a novel approach to identifying firms that discriminate against women. The researchers used the Equal Employment Opportunity

(EEOC) Systematic Gender Disparity Scorecard as a measure of the degree to which a firm complies with EEOC guidelines for eliminating gender bias. (EEOC Scorecard values range from 0 to 1, with larger values indicating a greater gender disparity.) In a hypothetical example, a sample of firms was selected for each of 30 different types of firms in the service industry (e.g., food service, financial services, oil and gas service, etc.) The mean scorecard values for the 30 firms types are plotted in the \(\bar{x}\)-chart shown above. The centerline and upper and lower control limits are shown on the chart.
a. Identify the rational subgroups used to construct the chart.
b. Identify the key variable plotted on the chart.
c. What are the approximate values of \(\bar{x}\), UCL, and LCL?
d. What conclusions can you draw from the chart? Are there any firm types that should concern the EEOC? Why?
Questions & Answers
QUESTION:
Detecting gender-related employment disparities. In the Federal Reserve Bank of Atlanta, Working Paper Series (Oct. 2008), researchers presented a novel approach to identifying firms that discriminate against women. The researchers used the Equal Employment Opportunity
(EEOC) Systematic Gender Disparity Scorecard as a measure of the degree to which a firm complies with EEOC guidelines for eliminating gender bias. (EEOC Scorecard values range from 0 to 1, with larger values indicating a greater gender disparity.) In a hypothetical example, a sample of firms was selected for each of 30 different types of firms in the service industry (e.g., food service, financial services, oil and gas service, etc.) The mean scorecard values for the 30 firms types are plotted in the \(\bar{x}\)-chart shown above. The centerline and upper and lower control limits are shown on the chart.
a. Identify the rational subgroups used to construct the chart.
b. Identify the key variable plotted on the chart.
c. What are the approximate values of \(\bar{x}\), UCL, and LCL?
d. What conclusions can you draw from the chart? Are there any firm types that should concern the EEOC? Why?
ANSWER:Step 1 of 5
The 
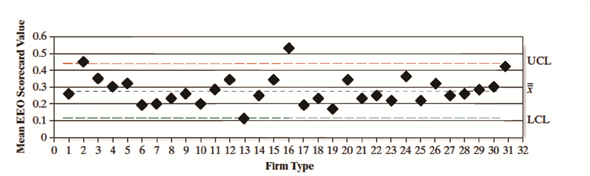
Figure (1)