Solution Found!
Construct and interpret an R-chart and an from the sample
Chapter 13, Problem 27E(choose chapter or problem)
QUESTION:
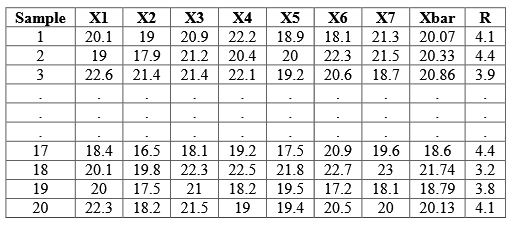
Construct and interpret an R-chart and an \(\bar{x}\)-chart from the sample data shown below. Remember to interpret the R-chart before the \(\bar{x}\)-chart.

Questions & Answers
QUESTION:
Construct and interpret an R-chart and an \(\bar{x}\)-chart from the sample data shown below. Remember to interpret the R-chart before the \(\bar{x}\)-chart.
ANSWER:
Step 1 of 3
The given data is
For the given data the R-chart is constructed by using software is shown below

From the above R-chart
The center line is 4.03
Upper control limit is 7.755, and
Lower control limit is 0.305