
Following are data on y ??green liquor (g/l) and x ??paper
Chapter 12, Problem 112SE(choose chapter or problem)
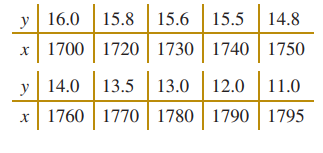
Following are data on \(y=\) green liquor \((g / I)\) and \(x=\) paper machine speed (feet per minute) from a Kraft paper machine. (The data were read from a graph in an article in the Tappi Journal, March 1986.)
(a) Fit the model \(Y=\beta_{0}+\beta_{1} x+\beta_{2} x^{2}+\epsilon\) using least squares.
(b) Test for significance of regression using \(\alpha=0.05\) What are your conclusions?
(c) Test the contribution of the quadratic tem to the model, over the contribution of the linear term, using an \(F\) -statistic. If \(\alpha=0.05\), what conclusion can you draw?
(d) Plot the residuals from the model in part (a) versus \(\hat{y}\). Does the plot reveal any inadequacies?
(e) Construct a normal probability plot of the residuals. Comment on the normality assumption.
Equation Transcription:
Text Transcription:
y=
(g/l)
x=
Y=\beta_{0}+\beta_{1} x+\beta_{2} x^{2}+\epsilon
\alpha=0.05
F
\alpha=0.05
\hat y
Unfortunately, we don't have that question answered yet. But you can get it answered in just 5 hours by Logging in or Becoming a subscriber.
Becoming a subscriber
Or look for another answer