
For each of the following exercises, use the
Chapter 13, Problem 29E(choose chapter or problem)
For each of the following exercises, use the previous data to complete these parts.
(a) Apply Fisher’s LSD method with \(\alpha=0.05\) and determine which levels of the factor differ.
(b) Use the graphical method to compare means described in this section and compare your conclusions to those from Fisher’s LSD method.
Diets in Exercise 13-15. Use \(\alpha=0.01\).
In the book Analysis of Longitudinal Data, 2nd ed., (2002, Oxford University Press), by Diggle, Heagerty, Liang, and Zeger, the authors analyzed the effects of three diets on the protein content of cow’s milk. The data shown here were collected after one week and include 25 cows on the barley diet and 27 cows each on the other two diets:
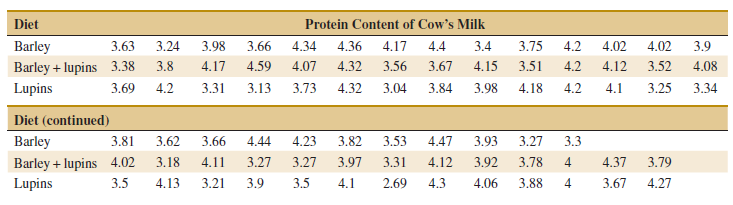
(a) Does diet affect the protein content of cow’s milk? Draw comparative box plots and perform an analysis of variance. Use \(\alpha=0.05\).
(b) Find the \(\text { P-value }\) of the test. Estimate the variability due to random error.
(c) Plot average protein content against diets and interpret the results.
(d) Analyze the residuals and comment on model adequacy.
Equation Transcription:
Text Transcription:
\alpha=0.05
\alpha=0.01
\alpha=0.05
P-value
Unfortunately, we don't have that question answered yet. But you can get it answered in just 5 hours by Logging in or Becoming a subscriber.
Becoming a subscriber
Or look for another answer