With aging, body fat increases and muscle mass declines. The line graphs show the
Chapter 3, Problem 74(choose chapter or problem)
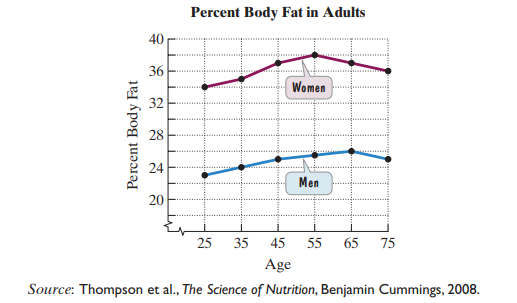
With aging, body fat increases and muscle mass declines. The line graphs show the percent body fat in adult women and men as they age from 25 to 75 years.
In Exercises 71–80, let p, q, and r represent the following simple statements:
p: The percent body fat in women peaks at age 55.
q: The percent body fat in men peaks at age 65.
r: Men have more than 24% body fat at age 25.
Write each symbolic statement in words. Then use the information given by the graph to determine the truth value of the statement.
\(q \wedge \sim p\)
Unfortunately, we don't have that question answered yet. But you can get it answered in just 5 hours by Logging in or Becoming a subscriber.
Becoming a subscriber
Or look for another answer