The table shows the number of births (in millions) and the population (in millions) of
Chapter 0, Problem 103(choose chapter or problem)
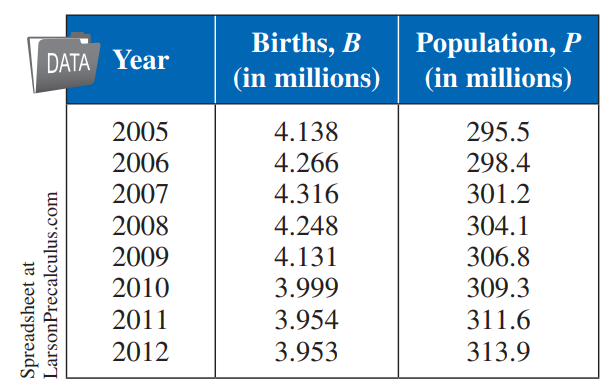
MODELING DATA
The table shows the number of births (in millions) and the population (in millions) of the United States from 2005 through 2012. (Sources: U.S. National Center for Health Statistics, U.S. Census Bureau)
Mathematical models for the data are
Births: \(B=\frac{0.06815 t^{2}-0.9865 t+3.948}{0.01753 t^{2}-0.2530 t+1}\)
and
Population: P = 2.64 t+282.7
where t represents the year, with t = 5 corresponding to 2005.
(a) Using the models, create a table to estimate the number of births and the number of people for each of the given years.
(b) Compare the estimates from part (a) with the actual data.
(c) Determine a model for the ratio of the number of births to the number of people.
(d) Use the model from part (c) to find the ratio for each of the given years. Interpret your results.
Text Transcription:
B=frac{0.06815 t^{2}-0.9865 t+3.948}{0.01753 t^{2}-0.2530 t+1}
Unfortunately, we don't have that question answered yet. But you can get it answered in just 5 hours by Logging in or Becoming a subscriber.
Becoming a subscriber
Or look for another answer