The revenues Rn (in millions of dollars) of Netflix from 2008 through 2013 are shown in
Chapter 9, Problem 124(choose chapter or problem)
The revenues \(R_{n}\) (in millions of dollars) of Netflix from 2008 through 2013 are shown in the table. (Source: Netflix, Inc.)
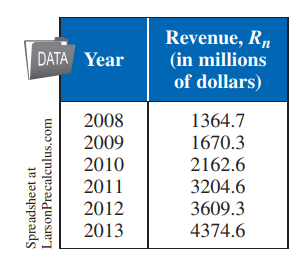
(a) Use a graphing utility to graph the data. Let n represent the year, with n = 8 corresponding to 2008.
(b) Use the regression feature of the graphing utility to find a linear sequence and a quadratic sequence that model the data. Identify the coefficient of determination for each model.
(c) Graph each model with the data. Decide which model is a better fit for the data. Explain.
(d) Use the model you chose in part (c) to predict the revenue of Netflix in 2017. Does your answer seem reasonable? Explain.
(e) Use your model from part (c) to find when the revenue will reach 15 billion dollars.
(f) Use the model you chose in part (c) to approximate the total revenue from 2008 through 2013. Compare this sum with the result of adding the revenues shown in the table.
Text Transcription:
R_n
Unfortunately, we don't have that question answered yet. But you can get it answered in just 5 hours by Logging in or Becoming a subscriber.
Becoming a subscriber
Or look for another answer