Solution Found!
Figure P2.1 shows a motion diagram of a car traveling down
Chapter 1, Problem 55P(choose chapter or problem)
Figure P1.55 shows a motion diagram of a car traveling down a street. The camera took one frame every \(10 s\). A distance scale is provided.
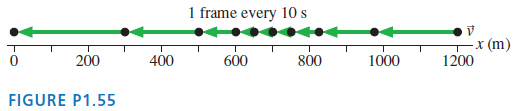
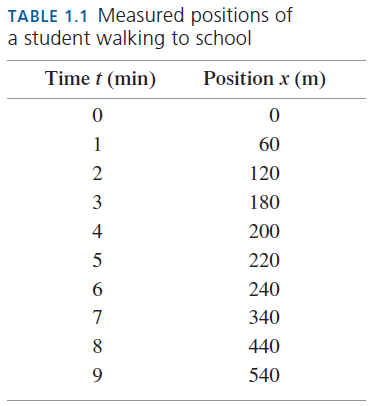
a. Measure the \(x\)-value of the car at each dot. Place your data in a table, similar to Table 1.1, showing each position and the instant of time at which it occurred.
b. Make a position-versus-time graph for the car. Because you have data only at certain instants of time, your graph should consist of dots that are not connected together.
Equation Transcription:
Text Transcription:
10 s
x-value
Questions & Answers
QUESTION:
Figure P1.55 shows a motion diagram of a car traveling down a street. The camera took one frame every \(10 s\). A distance scale is provided.
a. Measure the \(x\)-value of the car at each dot. Place your data in a table, similar to Table 1.1, showing each position and the instant of time at which it occurred.
b. Make a position-versus-time graph for the car. Because you have data only at certain instants of time, your graph should consist of dots that are not connected together.
Equation Transcription:
Text Transcription:
10 s
x-value
ANSWER:
Step 1 of 2
Part (a)
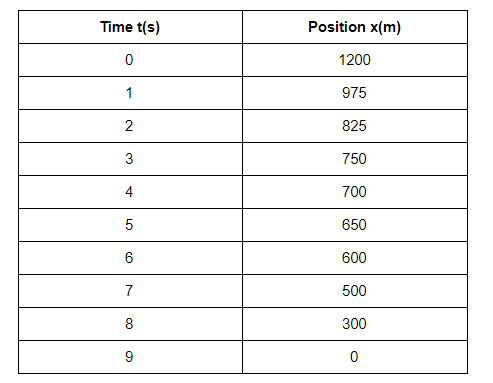
Our aim is to prepare the table containing the position of the car at each second as given in the diagram.
The measured positions of the car