Solution Found!
Solved: Seasons Average daily temperatures in January and
Chapter 5, Problem 38E(choose chapter or problem)
Average daily temperatures in January and July for 60 large U.S. cities are graphed in the following histograms.
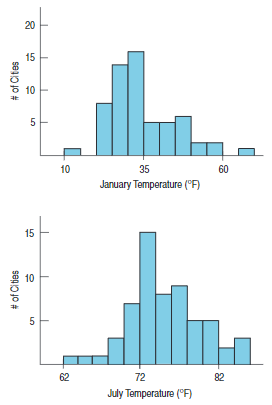
a) What aspect of these histograms makes it difficult to compare the distributions?
b) What differences do you see between the distributions of January and July average temperatures?
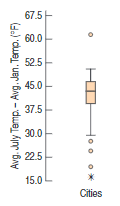
c) Differences in temperatures (July–January) for each of the cities are displayed in the boxplot above. Write a few sentences describing what you see.
Questions & Answers
QUESTION:
Average daily temperatures in January and July for 60 large U.S. cities are graphed in the following histograms.
a) What aspect of these histograms makes it difficult to compare the distributions?
b) What differences do you see between the distributions of January and July average temperatures?
c) Differences in temperatures (July–January) for each of the cities are displayed in the boxplot above. Write a few sentences describing what you see.
ANSWER:Step 1 of 3
a)
The distributions are shown in two separated graphs which makes the comparison hard. (they are not displayed side by side).