Cost of living 2013 Numbeo.com lists the cost of living
Chapter 6, Problem 66E(choose chapter or problem)
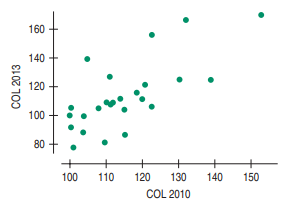
Cost of living 2013 Numbeo.com lists the cost of living (COL) for many cities around the world. These rankings scale New York City as 100, and express the cost of living in other cities as a percentage of the New York cost. For example, the table below shows 25 of the most expensive cities in the world, and indicates that the cost of living in Paris was 30.3% higher than New York in 2010, but only 25.0% higher in 2013.
a) Using the scatterplot below, describe the association between costs of living in 2010 and 2013.
b) The correlation is 0.714. Find and interpret the value of \(R^{2}\).
c) The regression equation predicting the 2013 cost of living from the 2010 figure is \(\widehat {COL 2013} = -38.292 + 1.319\) COL 2010. Use this equation to find the residual for Oslo.
d) Explain what the residual means.

Unfortunately, we don't have that question answered yet. But you can get it answered in just 5 hours by Logging in or Becoming a subscriber.
Becoming a subscriber
Or look for another answer