Solution Found!
Tracking hurricanes 2012 In a previous chapter, we saw
Chapter 8, Problem 24E(choose chapter or problem)
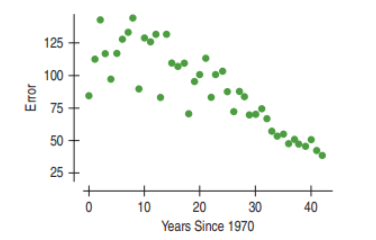
Tracking hurricanes 2012 In a previous chapter, we saw data on the errors (in nautical miles) made by the National Hurricane Center in predicting the path of hurricanes. The scatterplot at the top of the next page shows the trend in the 24-hour tracking errors since 1970 (www.nhc.noaa.gov).
\(\begin{array}{l}\text{Dependent variable is Error}\\
\begin{array}{ll}\text { R-squared }=72.5 \% \quad \mathrm{~S}_{\mathrm{e}}=16.13 \\
\text { Variable } & \text { Coefficient } \\
\text { Intercept } & 133.024 \\
\text { Years - } 1970 & -2.0602\end{array}\end{array}\)
a) Interpret the slope and intercept of the model.
b) Interpret \(s_{e}\) in this context.
c) The Center would like to achieve an average tracking error of 45 nautical miles by 2015. Will they make it? Defend your response.
d) What if their goal were an average tracking error of 25 nautical miles?
e) What cautions would you state about your conclusion?
Questions & Answers
QUESTION:
Tracking hurricanes 2012 In a previous chapter, we saw data on the errors (in nautical miles) made by the National Hurricane Center in predicting the path of hurricanes. The scatterplot at the top of the next page shows the trend in the 24-hour tracking errors since 1970 (www.nhc.noaa.gov).
\(\begin{array}{l}\text{Dependent variable is Error}\\
\begin{array}{ll}\text { R-squared }=72.5 \% \quad \mathrm{~S}_{\mathrm{e}}=16.13 \\
\text { Variable } & \text { Coefficient } \\
\text { Intercept } & 133.024 \\
\text { Years - } 1970 & -2.0602\end{array}\end{array}\)
a) Interpret the slope and intercept of the model.
b) Interpret \(s_{e}\) in this context.
c) The Center would like to achieve an average tracking error of 45 nautical miles by 2015. Will they make it? Defend your response.
d) What if their goal were an average tracking error of 25 nautical miles?
e) What cautions would you state about your conclusion?
ANSWER:Step 1 of 5
(a)
The regression model can be written as :
\(\widehat{\text { Error }}=133.024-2.0602 \text { Years }\)
This is in the linear model form, ie;
\(\hat{y}=b_{0}+b_{1} x \text {. }\)
where the b’s are called the coefficients of the linear model. The coefficient \(b_{1}\) is the slope, which tells how rapidly \(\hat{y}\) changes with respect to x. The coefficient \(b_{0}\) is the intercept, which tells where the line hits (intercepts) the y-axis.
Therefore,
The slope, \(b_{1}=-2.0602\), means error decreases on average of 2.0602 nautical miles per year. The intercept, \(b_{0}=133.024\), indicates that the prediction error is 133.024 nautical miles in the year 1970.