Energy Consumption and Gross National Product The data show the per capita energy
Chapter 1, Problem 5(choose chapter or problem)
The data show the per capita energy consumption (in millions of Btu) and the per capita gross national incomes (in thousands of U.S. dollars) for several countries in 2008. (Source: U.S. Energy Information Administration and The World Bank)
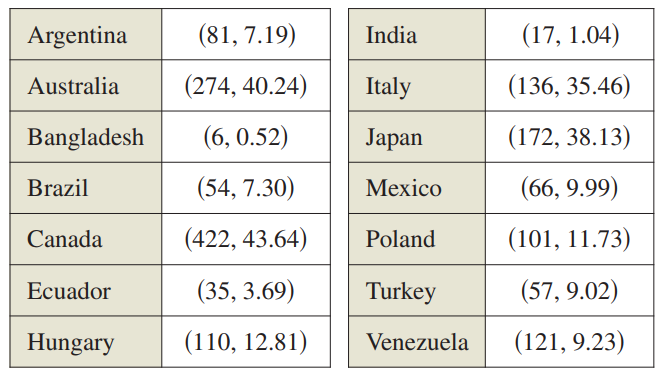
(a) Use the regression capabilities of a graphing utility to find a linear model for the data. What is the correlation coefficient?
(b) Use a graphing utility to plot the data and graph the model.
(c) Interpret the graph in part (b). Use the graph to identify the three countries that differ most from the linear model.
(d) Delete the data for the three countries identified in part (c). Fit a linear model to the remaining data and give the correlation coefficient.
Unfortunately, we don't have that question answered yet. But you can get it answered in just 5 hours by Logging in or Becoming a subscriber.
Becoming a subscriber
Or look for another answer