Modeling Data The table shows the resident populations (in millions) of the United
Chapter 6, Problem 61(choose chapter or problem)
The table shows the resident populations P (in millions) of the United States from 1920 to 2010. (Source: U.S. Census Bureau)
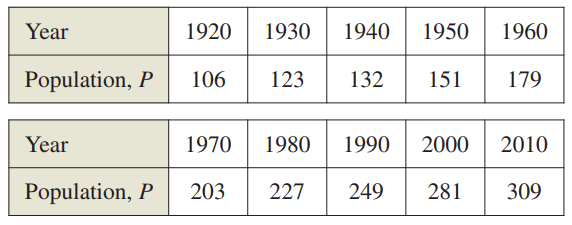
(a) Use the 1920 and 1930 data to find an exponential model \(P_{1}\) for the data. Let t = 0 represent 1920 .
(b) Use a graphing utility to find an exponential model \(P_{2}\) for all the data. Let t = 0 represent 1920 .
(c) Use a graphing utility to plot the data and graph models \(P_{1}\) and \(P_{2}\) in the same viewing window. Compare the actual data with the predictions. Which model better fits the data?
(d) Use the model chosen in part (c) to estimate when the resident population will be 400 million.
Text Transcription:
P_1
P_2
Unfortunately, we don't have that question answered yet. But you can get it answered in just 5 hours by Logging in or Becoming a subscriber.
Becoming a subscriber
Or look for another answer