U.S. oil produced and imported The figure shows the rate
Chapter 5, Problem 53E(choose chapter or problem)
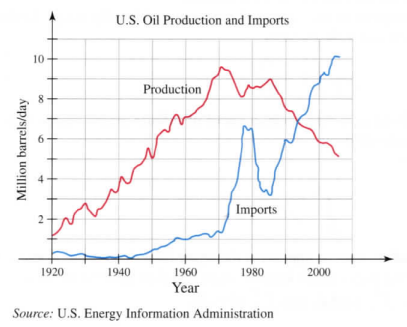
U.S. oil produced and imported The figure shows the rate at which U.S. oil was produced and imported between 1920 and 2005 in units of millions of barrels per day. The total amount of oil produced or imported is given by the area of the region under the corresponding curve. Be careful with units because both days and years are used in this data set.
(a) Use numerical integration to estimate the amount of U.S. oil produced between 1940 and 2000 . Use the method of your choice and experiment with values of n.
(b) Use numerical integration to estimate the amount of oil imported between 1940 and 2000 . Use the method of your choice and experiment with values of n.
Unfortunately, we don't have that question answered yet. But you can get it answered in just 5 hours by Logging in or Becoming a subscriber.
Becoming a subscriber
Or look for another answer