PreparED Study Materials
STAT 353: Statistics for Engineers
School: St. Cloud State University
Number of Notes and Study Guides Available: 1
Study Guides

Videos
Confidence Intervals for Bag Weights: A Statistical Guide

Want To Learn More? To watch the entire video and ALL of the videos in the series:
full solution
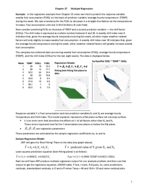
Understand the process of determining the 94.26% confidence interval for the median weight of "80-pound" bags of water softener pellets using a standard normal table and specified formulas. Additionally, explore the steps to deduce a confidence level of 90.47%.
Analyzing Salad Habits: A Statistical Look at 85.5%
Want To Learn More? To watch the entire video and ALL of the videos in the series:
full solution
Examine a survey of 200 adults regarding salad consumption, leading to a sample proportion of 85.5%. Using hypothesis testing and z-test calculations, the video determines whether more than 85% of American adults eat salad weekly. The results offer statistical insights into dietary habits.
Reaction Times in Anderson's Study: Analyzing Central Tendencies
Want To Learn More? To watch the entire video and ALL of the videos in the series:
full solution
Explore Anderson's 1999 study on how attention load impacts reaction times. Through hands-on analysis, understand the computation of mean, median, and mode from the provided data. Highlighting the significance of the median in capturing the central tendency amidst potential outliers.
Assumptions in Statistics: A High School Age Distribution Error
Want To Learn More? To watch the entire video and ALL of the videos in the series:
full solution
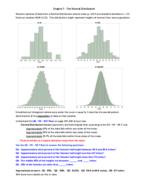
Analyze the statistical assumptions made about high school students' ages, emphasizing the importance of understanding distributions before applying the Standard Normal Table.
Margin of Error: Decoding the Uncertainty in Estimates
Want To Learn More? To watch the entire video and ALL of the videos in the series:
full solution
Unravel the concept of the "margin of error" within the context of estimating children's exposure to lead-based paint. Through clear explanations, comprehend the importance of acknowledging uncertainty in statistical findings and how it represents a range for potential true values.
011 Car Colors in North America: Trends & Visual Insights
Want To Learn More? To watch the entire video and ALL of the videos in the series:
full solution
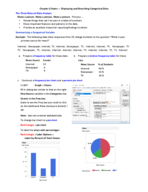
Discover the trends in car colors for North America in 2011. Break down the percentage distribution of various shades, from dominating whites to the less frequent greens. Understand the best visual techniques to represent this data, weighing the pros and cons of graphs.