PreparED Study Materials

STAT 0200: Basic Applied Statistics
School: University of Pittsburgh
Number of Notes and Study Guides Available: 4
Notes
Videos
Analyzing Student Homework Times: Quartiles & Data Insights

Want To Learn More? To watch the entire video and ALL of the videos in the series:
full solution
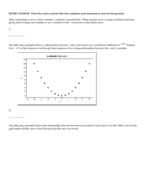
Examine a dataset that tracks student homework durations. Understand quartiles, the interquartile range, and skewness in the data. Discover insights into typical study durations and outlier behaviors.
Want To Learn More? To watch the entire video and ALL of the videos in the series:
full solution
Let Y be a random variable with mean 11 and variance 9
Want To Learn More? To watch the entire video and ALL of the videos in the series:
full solution
Calculating Permutations: 720 Ways to Arrange 6 Objects
Want To Learn More? To watch the entire video and ALL of the videos in the series:
full solution
Discover the principles of permutations with 6 distinct objects. Learn the ins and outs of factorial calculation and its application to combinatorics. Grasp the method to find the number of unique arrangements for any set of items.
Analyzing Ford F-750 Mileage Using Z-Scores & Probabilities
Want To Learn More? To watch the entire video and ALL of the videos in the series:
full solution
Explore how z-scores help analyze the mileage of Ford Super Duty F-750 trucks. Discover the percentages that reached specific mileage markers and grasp the significance of data using the z-table.
Analyzing U.S. Teacher Salaries: Where Do You Stand?
Want To Learn More? To watch the entire video and ALL of the videos in the series:
full solution
Explore the salary distribution of U.S. teachers using statistical analysis. Understand the probabilities of different salary brackets and evaluate a potential job offer in the context of nationwide data.