PreparED Study Materials

STAT 401: STAT 401
School: Pennsylvania State University
Number of Notes and Study Guides Available: 55
Study Guides


Videos
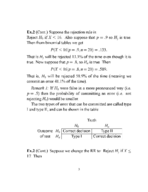
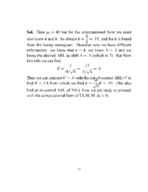
Brand X vs. Brand Y: 95% Confidence in Voltage Difference

Want To Learn More? To watch the entire video and ALL of the videos in the series:
full solution
Compare the voltages of Brand X and Brand Y batteries using statistical analysis. Learn how to determine a 95% confidence interval for their mean differences. Understand the process from data collection to interpretation of results.
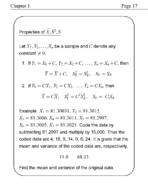
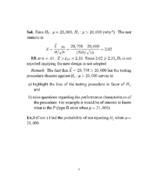
Analyzing Age Distribution of Proofreaders: A Statistical Approach
Want To Learn More? To watch the entire video and ALL of the videos in the series:
full solution
Discover the statistical process behind analyzing the age distribution of proofreaders at a publishing company. Learn how to use the Z-score formula for individual and sample mean probabilities, and how to interpret results using a Z-table.
Calculating Permutations: 720 Ways to Arrange 6 Objects
Want To Learn More? To watch the entire video and ALL of the videos in the series:
full solution
Discover the principles of permutations with 6 distinct objects. Learn the ins and outs of factorial calculation and its application to combinatorics. Grasp the method to find the number of unique arrangements for any set of items.
Real Cowboys' Lifespan: Debunking Wild West Myths
Want To Learn More? To watch the entire video and ALL of the videos in the series:
full solution
Explore the actual longevity of legendary cowboys using a detailed sociological study. With data visualization and historical references, challenge popular stereotypes and understand the reality of cowboy lives in the late 19th century.
Which Confidence Level Produces the Widest Interval? Explained!
Want To Learn More? To watch the entire video and ALL of the videos in the series:
full solution
Uncover the relationship between confidence levels and interval widths. Grasp how the range of confidence intervals broadens with increasing confidence. Understand the trade-offs in statistical certainty and estimation.
Calculating Confidence Interval for Educational TV Viewership
Want To Learn More? To watch the entire video and ALL of the videos in the series:
full solution
Learn how to determine a 90% confidence interval for the proportion of people who watch educational television based on a survey. Understand how to utilize the z-score and interpret results, guiding decisions for a television company's publicity efforts.
Textbook Solutions (0)
Top Selling Study Tools

Math 220 class notes 2.1-2.2 (Statistics)
STAT 220
Pennsylvania State University
3 pages | Fall 2016


Analysis of variance week 1 (Statistics)
STAT 461
Pennsylvania State University
1 page | Spring 2017