PreparED Study Materials

Videos
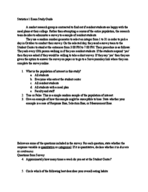
Predicting Preference: Using Binomial Distribution for a New Dairy For

Want To Learn More? To watch the entire video and ALL of the videos in the series:
full solution
Discover how the binomial distribution formula can predict the preference of judges for a new dairy drink formula. Understand the odds of different outcomes from unanimous approval to complete rejection. Dive into probability, expectations, and variance to decode consumer choices.
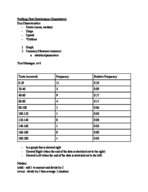
Analyzing Student Homework Times: Quartiles & Data Insights
Want To Learn More? To watch the entire video and ALL of the videos in the series:
full solution
Examine a dataset that tracks student homework durations. Understand quartiles, the interquartile range, and skewness in the data. Discover insights into typical study durations and outlier behaviors.
Real Cowboys' Lifespan: Debunking Wild West Myths
Want To Learn More? To watch the entire video and ALL of the videos in the series:
full solution
Explore the actual longevity of legendary cowboys using a detailed sociological study. With data visualization and historical references, challenge popular stereotypes and understand the reality of cowboy lives in the late 19th century.
Thread Strength After Heat Treatment: A 99% Confidence Analysis"
Want To Learn More? To watch the entire video and ALL of the videos in the series:
full solution
Explore the impact of heat treatment duration on thread breaking strength. Using statistical analysis, we assess the difference in mean strengths between batches. Confidence intervals help quantify this difference with 99% certainty.
Which Confidence Level Produces the Widest Interval? Explained!
Want To Learn More? To watch the entire video and ALL of the videos in the series:
full solution
Uncover the relationship between confidence levels and interval widths. Grasp how the range of confidence intervals broadens with increasing confidence. Understand the trade-offs in statistical certainty and estimation.
Analyzing U.S. Teacher Salaries: Where Do You Stand?
Want To Learn More? To watch the entire video and ALL of the videos in the series:
full solution
Explore the salary distribution of U.S. teachers using statistical analysis. Understand the probabilities of different salary brackets and evaluate a potential job offer in the context of nationwide data.