PreparED Study Materials

STAT 220: Matrices
School: Pennsylvania State University
Number of Notes and Study Guides Available: 1
Notes

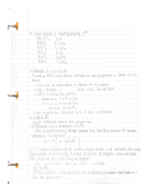
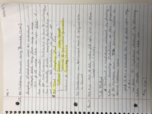
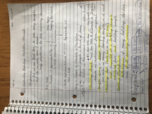
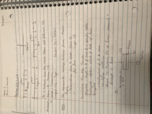
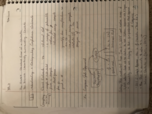
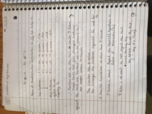
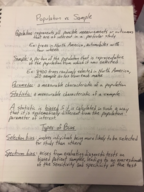
Math 220 class notes 2.1-2.2 (Statistics)
STAT 220
Pennsylvania State University
3 pages | Fall 2016
Videos
Poisson Analysis: Asthma ED Visits in Seattle

Want To Learn More? To watch the entire video and ALL of the videos in the series:
full solution
Unpack a Seattle-based study on Emergency Department asthma visits using the Poisson distribution. Explore the probability of visit frequencies and derive insights on healthcare patterns. Conclusions provide a statistical overview of asthma-related ED attendance.
Analyzing Age Distribution of Proofreaders: A Statistical Approach
Want To Learn More? To watch the entire video and ALL of the videos in the series:
full solution
Discover the statistical process behind analyzing the age distribution of proofreaders at a publishing company. Learn how to use the Z-score formula for individual and sample mean probabilities, and how to interpret results using a Z-table.
Chi-Square Observations: Probability of Exceeding 7.779
Want To Learn More? To watch the entire video and ALL of the videos in the series:
full solution
Discover how to compute the likelihood of observations exceeding a certain value in a chi-square distribution with 4 degrees of freedom. Using the binomial distribution formula, evaluate the chances of at most 3 out of 15 observations surpassing the 7.779 mark. Results highlight the intricacies of data distributions.
Margin of Error: Decoding the Uncertainty in Estimates
Want To Learn More? To watch the entire video and ALL of the videos in the series:
full solution
Unravel the concept of the "margin of error" within the context of estimating children's exposure to lead-based paint. Through clear explanations, comprehend the importance of acknowledging uncertainty in statistical findings and how it represents a range for potential true values.
Pet Phone Calls: Validating a 37% Claim with Z-test
Want To Learn More? To watch the entire video and ALL of the videos in the series:
full solution
Explore a claim from the American Animal Hospital Association that 37% of pet owners communicate with their pets over the phone. Through hypothesis testing and a z-test, evaluate a skeptical veterinarian's doubts. Conclusions shed light on pet owners' unique communication habits.
Analyzing Salad Habits: A Statistical Look at 85.5%
Want To Learn More? To watch the entire video and ALL of the videos in the series:
full solution
Examine a survey of 200 adults regarding salad consumption, leading to a sample proportion of 85.5%. Using hypothesis testing and z-test calculations, the video determines whether more than 85% of American adults eat salad weekly. The results offer statistical insights into dietary habits.
Textbook Solutions (0)
Top Selling Study Tools
Math 220 class notes 2.1-2.2 (Statistics)
STAT 220
Pennsylvania State University
3 pages | Fall 2016

Analysis of variance week 1 (Statistics)
STAT 461
Pennsylvania State University
1 page | Spring 2017