PreparED Study Materials

STAT 200: Elementary Statistics
School: Pennsylvania State University
Number of Notes and Study Guides Available: 139
Notes


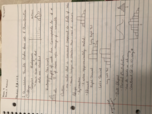
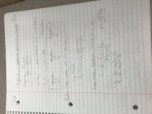
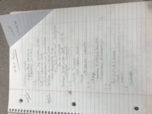
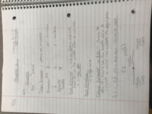
Stat 200 section 2.4 & 2.5 (Statistics)
STAT 200
Pennsylvania State University
2 pages | Winter 2015


Study Guides


Stat 200 final exam review (Statistics)
STAT 200
Pennsylvania State University
9 pages | Winter 2015


Stat200_final exam newa++ (Entomology)
STAT 200
Pennsylvania State University
17 pages | Winter 2015


Videos
Crunching Car Sales Data: Size, Color, and Probability Insights

Want To Learn More? To watch the entire video and ALL of the videos in the series:
full solution
Uncover the likelihood of different car combinations by size and color from a dealer's sales data. Learn how to calculate probabilities, from the chances of a small car being black to the odds a non-small car isn't gray. An insightful look into understanding car preferences.
Pet Phone Calls: Validating a 37% Claim with Z-test
Want To Learn More? To watch the entire video and ALL of the videos in the series:
full solution
Explore a claim from the American Animal Hospital Association that 37% of pet owners communicate with their pets over the phone. Through hypothesis testing and a z-test, evaluate a skeptical veterinarian's doubts. Conclusions shed light on pet owners' unique communication habits.
Real Cowboys' Lifespan: Debunking Wild West Myths
Want To Learn More? To watch the entire video and ALL of the videos in the series:
full solution
Explore the actual longevity of legendary cowboys using a detailed sociological study. With data visualization and historical references, challenge popular stereotypes and understand the reality of cowboy lives in the late 19th century.
Job Trends Analysis: Normal Approximation & Z-Values
Want To Learn More? To watch the entire video and ALL of the videos in the series:
full solution
Explore the nuances of determining the likelihood of specific employment patterns using statistical methods. Understand the application of the normal approximation to the binomial distribution and the role of z-values in probability determinations. Gain clarity on interpreting employment trends with the help of a standard normal table.
U.S. Adult Satisfaction in 2010: Confidence Interval Analysis
Want To Learn More? To watch the entire video and ALL of the videos in the series:
full solution
Discover how to construct a confidence interval for understanding U.S. adult satisfaction. Using a sample from a 2010 Gallup Poll, we unveil the proportion of adults pleased with the state of affairs, backed by statistical calculations.
Two-Sample T-Test: Analyzing Control vs. Supplemented Groups
Want To Learn More? To watch the entire video and ALL of the videos in the series:
full solution
Explore the steps to conduct a two-sample t-test using a control and supplemented group. Through hypothesis testing, standard deviation, and P-value interpretation, we analyze the means of both groups to determine statistical differences.
Textbook Solutions (0)
Top Selling Study Tools

Math 220 class notes 2.1-2.2 (Statistics)
STAT 220
Pennsylvania State University
3 pages | Fall 2016

Analysis of variance week 1 (Statistics)
STAT 461
Pennsylvania State University
1 page | Spring 2017

