PreparED Study Materials

STAT 325: Intro to Statistics
School: Kansas State University
Number of Notes and Study Guides Available: 28
Notes


Study Guides


Videos
Electronic Failures: Deciding Between Minor & Major Defects Cost-Effec

Want To Learn More? To watch the entire video and ALL of the videos in the series:
full solution
Discover the intricacies of determining the cause of electronic system failures, either minor or major defects, using statistical distributions. Learn how to minimize the expected cost and make informed decisions based on soundings and loss tables
Analyzing Student Homework Times: Quartiles & Data Insights
Want To Learn More? To watch the entire video and ALL of the videos in the series:
full solution
Examine a dataset that tracks student homework durations. Understand quartiles, the interquartile range, and skewness in the data. Discover insights into typical study durations and outlier behaviors.
011 Car Colors in North America: Trends & Visual Insights
Want To Learn More? To watch the entire video and ALL of the videos in the series:
full solution
Discover the trends in car colors for North America in 2011. Break down the percentage distribution of various shades, from dominating whites to the less frequent greens. Understand the best visual techniques to represent this data, weighing the pros and cons of graphs.
Analyzing Voter Demographics: Independence & Exclusivity
Want To Learn More? To watch the entire video and ALL of the videos in the series:
full solution
Analyze the relationships between different political affiliations and age groups. Determine whether certain events are independent, mutually exclusive, or neither, based on the provided probabilities. The findings offer a nuanced understanding of voter demographics and their interdependencies.
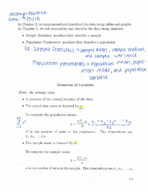
Probabilities with Poisson Variables X1 & X2
Want To Learn More? To watch the entire video and ALL of the videos in the series:
full solution
Explore the complexities of two independent Poisson random variables, X1 and X2, with means ?1 = 2 and ?2 = 3. Understand the process of calculating specific event probabilities and the application of the Poisson formula. Key takeaways include the manipulation and interpretation of these statistical values.
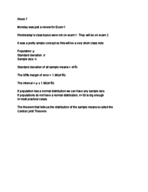
Americans on Marriage: Statistical Insights from a Sample
Want To Learn More? To watch the entire video and ALL of the videos in the series:
full solution
Review a Pew Research Center study on Americans' beliefs about marriage. Through statistical analysis, understand the sampling distribution, standard deviation, and the probabilities surrounding various beliefs. The insights detail public sentiments and the significance of sample outcomes.