PreparED Study Materials

Notes
Videos
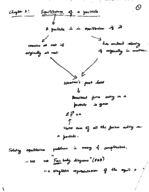
Analyzing Ford F-750 Mileage Using Z-Scores & Probabilities

Want To Learn More? To watch the entire video and ALL of the videos in the series:
full solution
Explore how z-scores help analyze the mileage of Ford Super Duty F-750 trucks. Discover the percentages that reached specific mileage markers and grasp the significance of data using the z-table.
Understanding Delaware's Income Distribution: A Statistical Look
Want To Learn More? To watch the entire video and ALL of the videos in the series:
full solution
Analyze Delaware's per capita annual income using statistical methods. Understand the probabilities associated with various income levels for a sample of state residents. Learn to use the Z score formula for such evaluations.
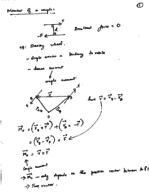
Decoding Probabilities: Unions, Intersections, and Complements
Want To Learn More? To watch the entire video and ALL of the videos in the series:
full solution
Explore the intricacies of calculating probabilities using set theory concepts such as union and intersection. With step-by-step computations, understand how to find the likelihood of events A and B occurring or not occurring together. Witness the application of classic probabilistic formulas.
Eye Color & Assortative Mating in Scandinavian Couples
Want To Learn More? To watch the entire video and ALL of the videos in the series:
full solution
Explore the concept of assortative mating through an eye-color study of 204 Scandinavian couples. Discover how probabilities highlight nonrandom mating patterns. Conclude if eye colors of partners are independent or reveal assortative tendencies.
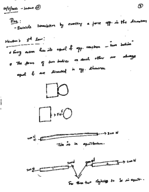
011 Car Colors in North America: Trends & Visual Insights
Want To Learn More? To watch the entire video and ALL of the videos in the series:
full solution
Discover the trends in car colors for North America in 2011. Break down the percentage distribution of various shades, from dominating whites to the less frequent greens. Understand the best visual techniques to represent this data, weighing the pros and cons of graphs.
Evaluating Expressions Using a Set of Scores
Want To Learn More? To watch the entire video and ALL of the videos in the series:
full solution
Discover the methodology behind evaluating various mathematical expressions using a given set of scores. By interpreting and applying summation notation, learn how to compute the desired results from a set of numbers. Key conclusions showcase the step-by-step calculations and their significance.