PreparED Study Materials

STAT 462: STAT 462
School: Pennsylvania State University
Number of Notes and Study Guides Available: 4
Study Guides


Videos
Analyzing U.S. Teacher Salaries: Where Do You Stand?

Want To Learn More? To watch the entire video and ALL of the videos in the series:
full solution
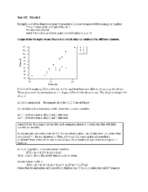
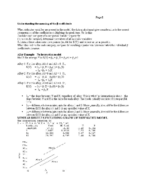
Explore the salary distribution of U.S. teachers using statistical analysis. Understand the probabilities of different salary brackets and evaluate a potential job offer in the context of nationwide data.
Analyzing Salad Habits: A Statistical Look at 85.5%
Want To Learn More? To watch the entire video and ALL of the videos in the series:
full solution
Examine a survey of 200 adults regarding salad consumption, leading to a sample proportion of 85.5%. Using hypothesis testing and z-test calculations, the video determines whether more than 85% of American adults eat salad weekly. The results offer statistical insights into dietary habits.
011 Car Colors in North America: Trends & Visual Insights
Want To Learn More? To watch the entire video and ALL of the videos in the series:
full solution
Discover the trends in car colors for North America in 2011. Break down the percentage distribution of various shades, from dominating whites to the less frequent greens. Understand the best visual techniques to represent this data, weighing the pros and cons of graphs.
Young Adults' TV Habits: Decoding Mean and Probability
Want To Learn More? To watch the entire video and ALL of the videos in the series:
full solution
Discover how to determine the probability and mean of young adults watching TV in a week. Using provided data, we compare the sample mean with the calculated population mean to interpret expected TV viewing habits.
Analyzing Teen Texting: Confidence Interval & Plausibility
Want To Learn More? To watch the entire video and ALL of the videos in the series:
full solution
Discover how to calculate the 95% confidence interval for a population proportion using sample data. Through a practical example about texting habits among American teens, learn the implications of this statistical tool and how to assess plausibility.
Car Theft Rates: Does Your Car Type Influence Risk?
Want To Learn More? To watch the entire video and ALL of the videos in the series:
full solution
Explore the relationship between specific car types and their theft rates. This video assesses correlations between car models like the Honda Accord, Toyota Camry, and others, emphasizing the difference between correlation and causation.
Textbook Solutions (0)
Top Selling Study Tools

Math 220 class notes 2.1-2.2 (Statistics)
STAT 220
Pennsylvania State University
3 pages | Fall 2016


Analysis of variance week 1 (Statistics)
STAT 461
Pennsylvania State University
1 page | Spring 2017