PreparED Study Materials

STAT 25626: Applied Regression
School: University of Pittsburgh
Number of Notes and Study Guides Available: 0
Videos
Computers in Schools: Probabilities & Distributions

Want To Learn More? To watch the entire video and ALL of the videos in the series:
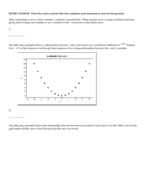
full solution
Assess the distribution of computers across schools using statistical methods. Determine the probability of a randomly selected school having a specific number of computers. From fewer than 50 to more than 100 computers, derive insightful conclusions about school infrastructures.
Analyzing Teen Texting: Confidence Interval & Plausibility
Want To Learn More? To watch the entire video and ALL of the videos in the series:
full solution
Discover how to calculate the 95% confidence interval for a population proportion using sample data. Through a practical example about texting habits among American teens, learn the implications of this statistical tool and how to assess plausibility.
Cereal Box Weights: Z-Scores, Probabilities & Truth Behind Claims
Want To Learn More? To watch the entire video and ALL of the videos in the series:
full solution
Explore the intricacies of evaluating cereal box weights using Z-scores and normal distribution. By examining both individual boxes and a sample mean, understand the probabilities of achieving certain weight values. Gain insights into how statistical tools help interpret real-world product claims.
Evaluating Tornado Length Claims: A Statistical Breakdown
Want To Learn More? To watch the entire video and ALL of the videos in the series:
full solution
Explore a statistical approach to analyze the claim about average tornado lengths. Understand the nuances of hypothesis testing, from setting null and alternative hypotheses to interpreting P-values. Witness a comprehensive breakdown of the evidence from a sample of 500 tornadoes.
Battery Lifetimes: Mean, Variance & Standard Deviation
Want To Learn More? To watch the entire video and ALL of the videos in the series:
full solution
Discover the nuances of analyzing battery lifetime data through mean, variance, and standard deviation computations. Using class boundaries, midpoints, and frequencies, gain insights into the dispersion of battery lifespans and the average deviation from the mean.
Analyzing U.S. Teacher Salaries: Where Do You Stand?
Want To Learn More? To watch the entire video and ALL of the videos in the series:
full solution
Explore the salary distribution of U.S. teachers using statistical analysis. Understand the probabilities of different salary brackets and evaluate a potential job offer in the context of nationwide data.