PreparED Study Materials

STAT 415: Mathematical Statistics II
School: Grand Valley State University
Number of Notes and Study Guides Available: 0
Videos
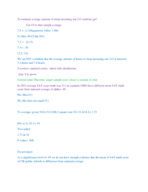
Exit Poll Analysis: Education Funding Referendum Votes

Want To Learn More? To watch the entire video and ALL of the videos in the series:
full solution
Explore the application of proportion z-tests in analyzing exit polling data. Understand how to determine the likelihood of sample results given a population proportion. Recognize the importance of considering non-sampling errors in interpreting exit poll outcomes.
42.1 Web Visits: How It Stacks Up to U.S. Average
Want To Learn More? To watch the entire video and ALL of the videos in the series:
full solution
Explore how hypothesis testing is used to compare a sample mean of Internet visits to the national average. Through calculations and statistical analysis, we determine if a sample of users' web usage significantly deviates from the average U.S. web usage.
Computing Probabilities: College Students & Computer Ownership
Want To Learn More? To watch the entire video and ALL of the videos in the series:
full solution
Understand the probabilities of computer ownership among university first-year students through various scenarios. This video breaks down calculations for chances of ownership and non-ownership among random groups.
Want To Learn More? To watch the entire video and ALL of the videos in the series:
full solution
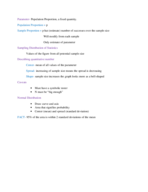
Analyzing Student Homework Times: Quartiles & Data Insights
Want To Learn More? To watch the entire video and ALL of the videos in the series:
full solution
Examine a dataset that tracks student homework durations. Understand quartiles, the interquartile range, and skewness in the data. Discover insights into typical study durations and outlier behaviors.
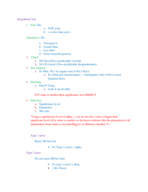
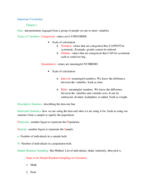
Analyzing Voter Demographics: Independence & Exclusivity
Want To Learn More? To watch the entire video and ALL of the videos in the series:
full solution
Analyze the relationships between different political affiliations and age groups. Determine whether certain events are independent, mutually exclusive, or neither, based on the provided probabilities. The findings offer a nuanced understanding of voter demographics and their interdependencies.