PreparED Study Materials

Notes

Study Guides
Videos
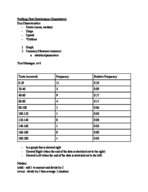
Comparing Ages: Slot Machine vs. Roulette Players

Want To Learn More? To watch the entire video and ALL of the videos in the series:
full solution
Examine the mean ages between two distinct groups: slot machine players and roulette enthusiasts. Utilizing the independent sample t-test, evaluate if there's a significant age difference between the two groups. The findings offer a nuanced understanding of player demographics in gaming environments.
Calculating Permutations: 720 Ways to Arrange 6 Objects
Want To Learn More? To watch the entire video and ALL of the videos in the series:
full solution
Discover the principles of permutations with 6 distinct objects. Learn the ins and outs of factorial calculation and its application to combinatorics. Grasp the method to find the number of unique arrangements for any set of items.
Poisson Analysis: Asthma ED Visits in Seattle
Want To Learn More? To watch the entire video and ALL of the videos in the series:
full solution
Unpack a Seattle-based study on Emergency Department asthma visits using the Poisson distribution. Explore the probability of visit frequencies and derive insights on healthcare patterns. Conclusions provide a statistical overview of asthma-related ED attendance.
Poisson Distribution in Event Count & Uranium Discovery
Want To Learn More? To watch the entire video and ALL of the videos in the series:
full solution
Explore the dynamics of Poisson distribution using both theoretical understanding and a practical application related to discovering uranium deposits. With the help of Bayes' formula and parameter adjustments, interpret various probabilities and outcomes for event occurrences.
Testing the 123-Gallon Daily Water Claim: Fact or Fiction?
Want To Learn More? To watch the entire video and ALL of the videos in the series:
full solution
Explore the claim that average daily water consumption is 123 gallons. Using statistical testing, we evaluate a new sample against the Old Farmer’s Almanac claim. Learn how to interpret p-values and t-scores in hypothesis testing.
Computers in Schools: Probabilities & Distributions
Want To Learn More? To watch the entire video and ALL of the videos in the series:
full solution
Assess the distribution of computers across schools using statistical methods. Determine the probability of a randomly selected school having a specific number of computers. From fewer than 50 to more than 100 computers, derive insightful conclusions about school infrastructures.