PreparED Study Materials
STAT 131: Introduction to Statistics for Life Scientists
School: University of California Berkeley
Number of Notes and Study Guides Available: 1
Study Guides
Videos
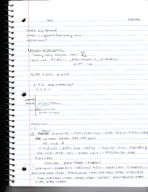
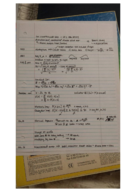
Battery Lifetimes: Mean, Variance & Standard Deviation

Want To Learn More? To watch the entire video and ALL of the videos in the series:
full solution
Discover the nuances of analyzing battery lifetime data through mean, variance, and standard deviation computations. Using class boundaries, midpoints, and frequencies, gain insights into the dispersion of battery lifespans and the average deviation from the mean.
Reaction Times in Anderson's Study: Analyzing Central Tendencies
Want To Learn More? To watch the entire video and ALL of the videos in the series:
full solution
Explore Anderson's 1999 study on how attention load impacts reaction times. Through hands-on analysis, understand the computation of mean, median, and mode from the provided data. Highlighting the significance of the median in capturing the central tendency amidst potential outliers.
Lake Macatawa Bacteria: 90% Confidence Analysis
Want To Learn More? To watch the entire video and ALL of the videos in the series:
full solution
Discover the method to analyze bacteria colonies in Lake Macatawa's east basin. Using 30 samples, we compute a 90% confidence interval for the mean colony count. Learn the steps of statistical analysis in environmental studies.
Committee Selection: Breaking Down Probabilities
Want To Learn More? To watch the entire video and ALL of the videos in the series:
full solution
Uncover the mathematical methods used to determine various probabilities when selecting committees. Utilize combination formulas and probabilities to evaluate different teacher-parent combinations.
Chi-Square Observations: Probability of Exceeding 7.779
Want To Learn More? To watch the entire video and ALL of the videos in the series:
full solution
Discover how to compute the likelihood of observations exceeding a certain value in a chi-square distribution with 4 degrees of freedom. Using the binomial distribution formula, evaluate the chances of at most 3 out of 15 observations surpassing the 7.779 mark. Results highlight the intricacies of data distributions.
Crunching Car Sales Data: Size, Color, and Probability Insights
Want To Learn More? To watch the entire video and ALL of the videos in the series:
full solution
Uncover the likelihood of different car combinations by size and color from a dealer's sales data. Learn how to calculate probabilities, from the chances of a small car being black to the odds a non-small car isn't gray. An insightful look into understanding car preferences.