PreparED Study Materials

STAT 703: Intro to Statistical Methods for Science
School: Kansas State University
Number of Notes and Study Guides Available: 0
Videos
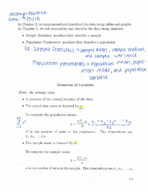
Calculating Confidence Interval for Educational TV Viewership

Want To Learn More? To watch the entire video and ALL of the videos in the series:
full solution
Learn how to determine a 90% confidence interval for the proportion of people who watch educational television based on a survey. Understand how to utilize the z-score and interpret results, guiding decisions for a television company's publicity efforts.
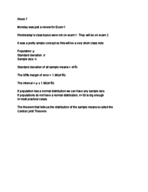
Estimating Study Hours: A 99% Confidence Method"
Want To Learn More? To watch the entire video and ALL of the videos in the series:
full solution
Explore how a university dean estimates freshmen study hours using statistical methods. Understand the importance of z-scores, confidence levels, and sample sizes in making accurate predictions. Learn how to ensure results are within a desired error margin.
Analyzing Grade Variance: Is it More than Usual? A Chi-Square Test
Want To Learn More? To watch the entire video and ALL of the videos in the series:
full solution
Discover the process of analyzing variance in midterm grades with a Chi-Square test. Understand the significance of high variance and its implications. Follow along as we assess a professor's suspicion about unusually varied student performance.
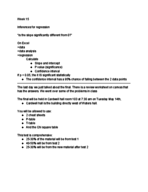
ACT Score Bet: Who Owes the Pizza? A 7.6% Chance Explained
Want To Learn More? To watch the entire video and ALL of the videos in the series:
full solution
Discover the friendly bet between Leona and Fred surrounding their ACT scores and who owes who a pizza. Using statistical principles like Z-scores and the normal distribution, we'll decipher the odds of one outperforming the other by 5 points.
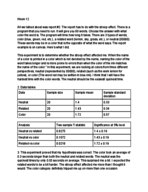
42.1 Web Visits: How It Stacks Up to U.S. Average
Want To Learn More? To watch the entire video and ALL of the videos in the series:
full solution
Explore how hypothesis testing is used to compare a sample mean of Internet visits to the national average. Through calculations and statistical analysis, we determine if a sample of users' web usage significantly deviates from the average U.S. web usage.
Choosing Samples: The Math of Online Freebies
Want To Learn More? To watch the entire video and ALL of the videos in the series:
full solution
Discover the mathematical principles behind choosing free samples in online shopping scenarios. Understand combinations, how to calculate them, and see real-world examples of selecting multiple items.