PreparED Study Materials

STAT 325: Intro to Statistics
School: Kansas State University
Number of Notes and Study Guides Available: 28
Notes


Study Guides


Videos
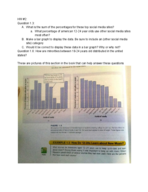
Analyzing Movie Habits Survey: Uncovering Hidden Biases

Want To Learn More? To watch the entire video and ALL of the videos in the series:
full solution
Unpack the potential biases in a survey about movie-watching habits based on its design and constraints. Learn how limiting to residential phones and specific time frames can affect results. Recommendations are made to ensure a broader, more accurate perspective.
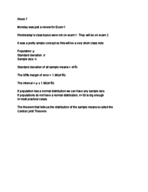
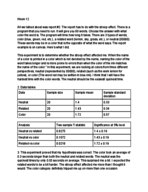
Reaction Times in Anderson's Study: Analyzing Central Tendencies
Want To Learn More? To watch the entire video and ALL of the videos in the series:
full solution
Explore Anderson's 1999 study on how attention load impacts reaction times. Through hands-on analysis, understand the computation of mean, median, and mode from the provided data. Highlighting the significance of the median in capturing the central tendency amidst potential outliers.
Calculating Mean & Modal Class for Million-Dollar Bonuses
Want To Learn More? To watch the entire video and ALL of the videos in the series:
full solution
Learn how to determine the mean and modal class for bonuses in millions. Understand midpoint calculations and how frequencies impact results. Gain insights into bonus distributions in the financial realm.
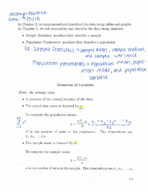
Predicting Preference: Using Binomial Distribution for a New Dairy For
Want To Learn More? To watch the entire video and ALL of the videos in the series:
full solution
Discover how the binomial distribution formula can predict the preference of judges for a new dairy drink formula. Understand the odds of different outcomes from unanimous approval to complete rejection. Dive into probability, expectations, and variance to decode consumer choices.
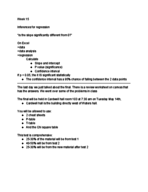
Understanding Null vs Alternative Hypotheses in Real-world Scenarios
Want To Learn More? To watch the entire video and ALL of the videos in the series:
full solution
Explore various scenarios and understand the fundamental principles of the null and alternative hypotheses in statistical testing. This video breaks down how these hypotheses represent current beliefs and potential deviations, aiding in the interpretation of statistical findings.
Sullivan's Algebra Scores: Frequency to Probabilities Analysis
Want To Learn More? To watch the entire video and ALL of the videos in the series:
full solution
Explore Sullivan’s College Algebra homework score analysis, from frequency distribution construction to in-depth statistical calculations such as standard deviation. Discover histogram visualizations, mean and median interpretations, and probability estimations for various score thresholds. Utilize Excel functions for precise calculations.