J. H. Matis and T. E. Wehrly5 report the following table
Chapter 11, Problem 14E(choose chapter or problem)
J. H. Matis and T. E. Wehrly5 report the following table of data on the proportion of green sunfish that survive a fixed level of thermal pollution for varying lengths of time.
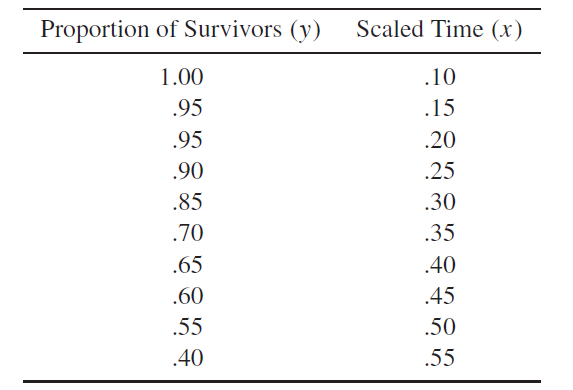
a Fit the linear model \(Y=\beta_{0}+_{1} x+\varepsilon\). Give your interpretation.
b Plot the points and graph the result of part (a). Does the line fit through the points?
Equation transcription:
Text transcription:
Y=beta{0}+{1} x+varepsilon
Unfortunately, we don't have that question answered yet. But you can get it answered in just 5 hours by Logging in or Becoming a subscriber.
Becoming a subscriber
Or look for another answer