Solution Found!
The accompanying table gives the peak power load for a
Chapter 11, Problem 48E(choose chapter or problem)
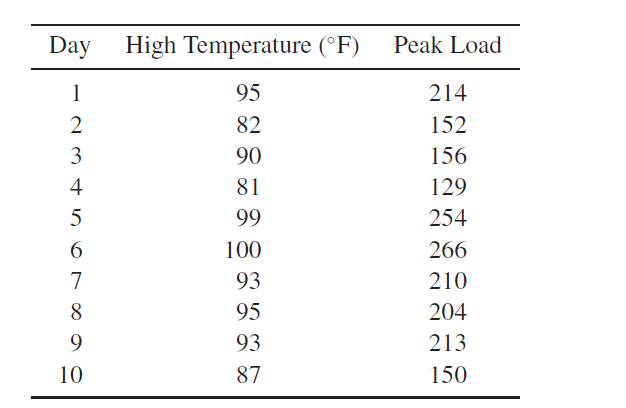
The accompanying table gives the peak power load for a power plant and the daily high temperature for a random sample of 10 days. Test the hypothesis that the population correlation coefficient ρ between peak power load and high temperature is zero versus the alternative that it is positive. Use \(\alpha=.05\). Bound or determine the attained significance level.
Equation transcription:
Text transcription:
\alpha=.05
Questions & Answers
QUESTION:
The accompanying table gives the peak power load for a power plant and the daily high temperature for a random sample of 10 days. Test the hypothesis that the population correlation coefficient ρ between peak power load and high temperature is zero versus the alternative that it is positive. Use \(\alpha=.05\). Bound or determine the attained significance level.
Equation transcription:
Text transcription:
\alpha=.05
ANSWER:Step 1 of 5
Given:
The data for the peak power load for a power plant and the daily high temperature for a random sample of 10 days is provided.
The level of significance is 0.05.