Solution Found!
Solved: One graph in the figure at the top of the next
Chapter 7, Problem 24AYU(choose chapter or problem)
QUESTION:
One graph in the figure at the top of the next column represents a normal distribution with mean \(\mu=8\) and standard deviation \(\sigma=2\). The other graph represents a normal distribution with mean \(\mu=14\) and standard deviation \(\sigma=2\). Determine which graph is which and explain how you know
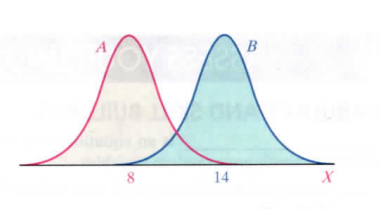
.
Questions & Answers
QUESTION:
One graph in the figure at the top of the next column represents a normal distribution with mean \(\mu=8\) and standard deviation \(\sigma=2\). The other graph represents a normal distribution with mean \(\mu=14\) and standard deviation \(\sigma=2\). Determine which graph is which and explain how you know
.
ANSWER:Step 1 of 2
Graph A: = 8,
= 2;
Graph B: = 14,
= 2.