


Problem 1CQ A person gets in an elevator on the ground floor and rides it to the top floor of a building. Sketch a velocity-versus-time graph for this motion.
Read moreTable of Contents
I
II
III
IV
V
VI
VII
1
Representing Motion
2
Motion in One Dimension
3
Vectors and Motion in Two Dimensions
4
Forces and Newton's laws of Motion
5
Applying Newton's Laws
6
Circular Motion, Orbits,and Gravity
7
Rotational Motion
8
Equilibrium and Elasticity
9
Momentum
10
Energy and Work
11
Using Energy
12
Thermal Properties of Matter
13
Fluids
14
Oscillations
15
Traveling Waves and Sound
16
Superposition and Standing Waves
17
Wave Optics
18
Ray Optics
19
Optical Instruments
20
Electric Fields and Forces
21
Electric Potential
22
Current and Resistance
23
Circuits
24
Magnetic Fields and Forces
25
Electromagnetic Induction and Electromagnetic Waves
26
AC Electricity
27
Relativity
28
Quantum Physics
29
Atoms and Molecules
30
Nuclear Physics
Textbook Solutions for College Physics
Chapter 2 Problem 20P
Question
Problem 20P
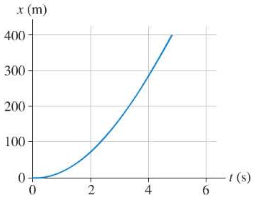
Figure P2.18 shows a graph of actual position-versus-time data for a particular type of drag racer known as a “funny car.”
a. Estimate the car’s velocity at 2.0 s.
b. Estimate the car’s velocity at 4.0 s.
Solution
Problem 20P
Figure P2.18 shows a graph of actual position-versus-time data for a particular type of drag racer known as a “funny car.”
a. Estimate the car’s velocity at 2.0 s.
b. Estimate the car’s velocity at 4.0 s
:
Step By Step Solution
Step 1 of 2
(a)
Car’s velocity at 2.0s:
This is a displacement time graph, velocity from x-t graph is the slope of the surve.
At t=2s,
We will draw a tangent such that,
Thus, velocity at t=2s is 66.7m/s
Subscribe to view the
full solution
full solution
Title
College Physics 12
Author
Randall D. Knight
ISBN
9780321595492
Figure P2.18 shows a graph of actual position-versus-time
Chapter 2 textbook questions
-
Chapter : Problem 1 College Physics 12
-
Chapter : Problem 1 College Physics 12
Problem 1P Figure P2.1 shows a motion diagram of a car traveling down a street. The camera took one frame every second. A distance scale is provided. a. Measure the x -value of the car at each dot. Place your data in a table, similar to Table 2.1 , showing each position and the instant of time at which it occurred. b. Make a graph of x versus t , using the data in your table. Because you have data only at certain instants of time, your graph should consist of dots that are not connected together. Reference: Table 2.1:
Read more -
Chapter : Problem 2 College Physics 12
Problem 2CQ a. Give an example of a vertical motion with a positive velocity and a negative acceleration. b. Give an example of a vertical motion with a negative velocity and a negative acceleration.
Read more -
Chapter : Problem 2 College Physics 12
Problem 2P For each motion diagram in Figure P2.2 , determine the sign (positive or negative) of the position and the velocity.
Read more -
Chapter : Problem 3 College Physics 12
Problem 3CQ Sketch a velocity-versus-time graph for a rock that is thrown straight upward, from the instant it leaves the hand until the instant it hits the ground.
Read more -
Chapter : Problem 3 College Physics 12
Problem 3P Write a short description of the motion of a real object for which Figure 3 would be a realistic position-versus-time graph. FIGURE 3
Read more -
Chapter : Problem 4 College Physics 12
Problem 4CQ You are driving down the road at a constant speed. Another car going a bit faster catches up with you and passes you. Draw a position graph for both vehicles on the same set of axes, and note the point on the graph where the other vehicle passes you.
Read more -
Chapter : Problem 4 College Physics 12
Problem 4P Write a short description of the motion of a real object for which Figure 4 would be a realistic position-versus-time graph. FIGURE 4
Read more -
Chapter : Problem 5 College Physics 12
Problem 5CQ A car is traveling north. Can its acceleration vector every point south? Explain.
Read more -
Chapter : Problem 5 College Physics 12
The position graph of Figure P2.5 shows a dog slowly sneaking up on a squirrel, then putting on a burst of speed. a. For how many seconds does the dog move at the slower speed? b. Draw the dog’s velocity-versus-time graph. Include a numerical scale on both axes.
Read more -
Chapter : Problem 6 College Physics 12
Problem 6CQ Certain animals are capable of running at great speeds; other animals are capable of tremendous accelerations. Speculate on which would be more beneficial to a predator—large maximum speed or large acceleration.
Read more -
Chapter : Problem 6 College Physics 12
Problem 6P The position graph of Figure 6 represents the motion of a ball being rolled back and forth by two children. a. At what positions are the two children sitting? ________________ b. Draw the ball’s velocity-versus-time graph. Include a numerical scale on both axes. FIGURE 6
Read more -
Chapter : Problem 7 College Physics 12
Problem 7CQ A ball is thrown straight up into the air. At each of the following instants, is the ball’s acceleration ay equal to g , -g, 0, < g, or >g? a. Just after leaving your hand? b. At the very top (maximum height)? c. Just before hitting the ground?
Read more -
Chapter : Problem 7 College Physics 12
A rural mail carrier is driving slowly, putting mail in mailboxes near the road. He overshoots one mailbox, stops, shifts into reverse, and then backs up until he is at the right spot. The velocity graph of Figure P2.4 represents his motion. a. Draw the mail carrier’s position-versus-time graph. Assume that x = 0 m at t = 0 s. b. What is the position of the mailbox?
Read more -
Chapter : Problem 8 College Physics 12
Problem 8CQ A rock is thrown (not dropped) straight down from a bridge into the river below. a. Immediately after being released, is the magnitude of the rock’s acceleration greater than g , less than g , or equal to g ? Explain. b. Immediately before hitting the water, is the magnitude of the the rock’s acceleration greater than g , less than g , or equal to g ? Explain.
Read more -
Chapter : Problem 8 College Physics 12
Problem 8P For the velocity-versus-time graph of Figure P2.5 : a. Draw the corresponding position-versus-time graph. Assume that x = 0 m at t = 0 s. b. What is the object’s position at t = 12 s? c. Describe a moving object that could have these graphs.
Read more -
Chapter : Problem 9 College Physics 12
Problem 9CQ Figure Q2.10 shows an object’s position-versus-time graph. The letters A to E correspond to various segments of the motion in which the graph has constant slope. a. Write a realistic motion short story for an object that would have this position graph. b. In which segment(s) is the object at rest? c. In which segment(s) is the object moving to the right? d. Is the speed of the object during segment C greater than, equal to, or less than its speed during segment E? Explain
Read more -
Chapter : Problem 9 College Physics 12
A bicyclist has the position-versus-time graph shown in Figure P2.9 . What is the bicyclist’s velocity at t = 10 s, at t = 25 s, and at t = 35 s?
Read more -
Chapter : Problem 10 College Physics 12
Problem 10CQ Figure Q2.11 shows the position graph for an object moving along the horizontal axis. a. Write a realistic motion short story for an object that would have this position graph. b. Draw the corresponding velocity graph.
Read more -
Chapter : Problem 10 College Physics 12
Problem 10P In college softball, the distance from the pitcher’s mound to the batter is 43 feet. If the ball leaves the bat at 100 mph, how much time elapses between the hit and the ball reaching the pitcher?
Read more -
Chapter : Problem 11 College Physics 12
Problem 11CQ Figure Q2.12 shows the position-versus-time graphs for two objects, A and B, that are moving along the same axis. a. At the instant t = 1 s, is the speed of A greater than, less than, or equal to the speed of B? Explain. b. Do objects A and B ever have the same speed? If so, at what time or times? Explain.
Read more -
Chapter : Problem 11 College Physics 12
Problem 11P Alan leaves Los Angeles at 8:00 am to drive to San Francisco, 400 mi away. He travels at a steady 50 mph. Beth leaves Los Angeles at 9:00 am and drives a steady 60 mph. a. Who gets to San Francisco first? b. How long does the first to arrive have to wait for the second?
Read more -
Chapter : Problem 12 College Physics 12
Problem 12CQ Figure Q2.13 shows a position-versus-time graph. At which lettered point or points is the object a. Moving the fastest? b. Moving to the left? c. Speeding up? d. Slowing down? e. Turning around?
Read more -
Chapter : Problem 12 College Physics 12
Problem 12P Richard is driving home to visit his parents. 125 mi of the trip are on the interstate highway where the speed limit is 65 mph. Normally Richard drives at the speed limit, but today he is running late and decides to take his chances by driving at 70 mph. How many minutes does he save?
Read more -
Chapter : Problem 13 College Physics 12
Problem 13CQ Figure Q2.14 is the velocity-versus-time graph for an object moving along the x-axis. a. During which segment(s) is the velocity constant? b. During which segment(s) is the object speeding up? c. During which segment(s) is the object slowing down? d. During which segment(s) is the object standing still? e. During which segment(s) is the object moving to the right?
Read more -
Chapter : Problem 13 College Physics 12
Problem 13P In a 5.00 km race, one runner runs at a steady 12.0 km/h and another runs at 14.5 km/h. How long does the faster runner have to wait at the finish line to see the slower runner cross?
Read more -
Chapter : Problem 14 College Physics 12
Problem 14CQ A car traveling at velocity v takes distance d to stop after the brakes are applied. What is the stopping distance if the car is initially traveling at velocity 2v? Assume that the acceleration due to the braking is the same in both cases.
Read more -
Chapter : Problem 14 College Physics 12
Problem 14P In an 8.00 km race, one runner runs at a steady 11.0 km/h and another runs at 14.0 km/h. How far from the finish line is the slower runner when the faster runner finishes the race?
Read more -
Chapter : Problem 15 College Physics 12
Problem 15MCQ Figure Q2.15 shows the position graph of a car traveling on a straight road. At which labeled instant is the speed of the car greatest?
Read more -
Chapter : Problem 15 College Physics 12
Problem 15P A car moves with constant velocity along a straight road. Its position . Answer the following by considering ratios, without computing the car’s velocity. a. What is the car’s position at t = 1.5 s? b. What will be its position at t = 9.0 s?
Read more -
Chapter : Problem 16 College Physics 12
Problem 16MCQ Figure Q2.16 shows the position graph of a car traveling on a straight road. The velocity at instant 1 is _________ and the velocity at instant 2 is _________. A. positive, negative B. positive, positive C. negative, negative D. negative, zero E. positive, zero
Read more -
Chapter : Problem 16 College Physics 12
Problem 16P While running a marathon, a long-distance runner uses a stopwatch to time herself over a distance of 100 m. She finds that she runs this distance in 18 s. Answer the following by considering ratios, without computing her velocity. a. If she maintains her speed, how much time will it take her to run the next 400 m? b. How long will it take her to run a mile at this speed?
Read more -
Chapter : Problem 17 College Physics 12
Problem 17MCQ Figure Q2.17 shows an object’s position-versus-time graph. What is the velocity of the object at t = 6 s? A. 0.67 m/s B. 0.83 m/s C. 3.3 m/s D. 4.2 m/s E. 25 m/s
Read more -
Chapter : Problem 17 College Physics 12
Problem 17P Figure P2.15 shows the position graph of a particle. a. Draw the particle’s velocity graph for the interval . b. Does this particle have a turning point or points? If so, at what time or times?
Read more -
Chapter : Problem 18 College Physics 12
Problem 18MCQ The following options describe the motion of four cars A–D. Which car has the largest acceleration? A. Goes from 0 m/s to 10 m/s in 5.0 s B. Goes from 0 m/s to 5.0 m/s in 2.0 s C. Goes from 0 m/s to 20 m/s in 7.0 s D. Goes from 0 m/s to 3.0 m/s in 1.0 s
Read more -
Chapter : Problem 18 College Physics 12
A somewhat idealized graph of the speed of the blood in the ascending aorta during one beat of the heart appears as in Figure P2.18. a. Approximately how far, in \(\mathrm{cm}\), does the blood move during one beat? b. Assume similar data for the motion of the blood in your aorta. Estimate how many beats of the heart it will it take the blood to get from your heart to your brain.
Read more -
Chapter : Problem 19 College Physics 12
Problem 19MCQ A car is traveling at . The driver applies the brakes, and the car slows with . What is the stopping distance? A. 5.0 m B. 25 m C. 40 m D. 50 m
Read more -
Chapter : Problem 19 College Physics 12
Problem 19P A car starts from and moves with the velocity graph shown in Figure P2.17. a. What is the car’s position at t = 2 s, 3 s, and 4 s? b. Does this car ever change direction? If so, at what time?
Read more -
Chapter : Problem 20 College Physics 12
Velocity-versus-time graphs for three drag racers are shown in Figure Q2.20. At \(t\) = 5.0 s, which car has traveled the furthest? A. Andy B. Belly C. Carl D. All have traveled the same distance
Read more -
Chapter : Problem 20 College Physics 12
Problem 20P Figure P2.18 shows a graph of actual position-versus-time data for a particular type of drag racer known as a “funny car.” a. Estimate the car’s velocity at 2.0 s. b. Estimate the car’s velocity at 4.0 s.
Read more -
Chapter : Problem 21 College Physics 12
Problem 21MCQ Which of the three drag racers in Question 20 had the greatest acceleration at t = 0 s? A. Andy B. Betty C. Carl D. All had the same acceleration
Read more -
Chapter : Problem 21 College Physics 12
Problem 21P Figure P2.19 shows the velocity graph of a bicycle. Draw the bicycle’s acceleration graph for the interval . Give both axes an appropriate numerical scale.
Read more -
Chapter : Problem 22 College Physics 12
Problem 22MCQ Ball 1 is thrown straight up in the air and, at the same instant, ball 2 is released from rest and allowed to fall. Which velocity graph in Figure 22 best represents the motion of the two balls? FIGURE 22
Read more -
Chapter : Problem 22 College Physics 12
Problem 22P Figure 22 shows the velocity graph of a train that starts from the origin at t = 0 s. a. Draw position and acceleration graphs for the train. b. Find the acceleration of the train at t = 3.0 s. FIGURE 22
Read more -
Chapter : Problem 23 College Physics 12
Problem 23MCQ Figure Q2.24 shows a motion diagram with the clock reading (in seconds) shown at each position. From t = 9 s to t = 15 s the object is at the same position. After that, it returns along the same track. The positions of the dots for t ? 16 s are offset for clarity. Which graph best represents the object’s velocity?
Read more -
Chapter : Problem 23 College Physics 12
Problem 23P For each motion diagram shown earlier in Figure P2.2, determine the sign (positive or negative) of the acceleration.
Read more -
Chapter : Problem 24 College Physics 12
Problem 24MCQ A car can go from 0 to 60 mph in 7.0 s. Assuming that it could maintain the same acceleration at higher speeds, how long would it take the car to go from 0 to 120 mph? A. 10 s B. 14 s C. 21 s D. 28 s
Read more -
Chapter : Problem 24 College Physics 12
Problem 24P Figure P2.16 showed data for the speed of blood in the aorta. Determine the magnitude of the acceleration for both phases, speeding up and slowing down.
Read more -
Chapter : Problem 25 College Physics 12
Problem 25MCQ A car can go from 0 to 60 mph in 12 s. A second car is capable of twice the acceleration of the first car. Assuming that it could maintain the same acceleration at higher speeds, how much time will this second car take to go from 0 to 120 mph? A. 12 s B. 9.0 s C. 6.0 s D. 3.0 s
Read more -
Chapter : Problem 25 College Physics 12
Problem 25P Figure P2.23 is a somewhat simplified velocity graph for Olympic sprinter Carl Lewis starting a 100m dash. Estimate his acceleration during each of the intervals A, B, and C.
Read more -
Chapter : Problem 27 College Physics 12
Problem 27P When striking, the pike, a predatory fish, can accelerate from rest to a speed of 4.0 m/s in 0.11 s. a. What is the acceleration of the pike during this strike? b. How far does the pike move during this strike?
Read more -
Chapter : Problem 28 College Physics 12
Problem 28P a. What constant acceleration, in SI units, must a car have to go from zero to 60 mph in 10 s? b. What fraction of g is this? c. How far has the car traveled when it reaches 60 mph? Give your answer both in SI units and in feet.
Read more -
Chapter : Problem 29 College Physics 12
Problem 29P Light-rail passenger trains that provide transportation within and between cities are capable of modest accelerations. The magnitude of the maximum acceleration is typically 1.3 m/s2, but the driver will usually maintain a constant acceleration that is less than the maximum. A train travels through a congested part of town at 5.0 m/s. Once free of this area, it speeds up to 12 m/s in 8.0 s. At the edge of town, the driver again accelerates, with the same acceleration, for another 16 s to reach a higher cruising speed. What is the final speed?
Read more -
Chapter : Problem 30 College Physics 12
Problem 30P A speed skater moving across frictionless ice at 8.0 m/s hits a 5.0-m-wide patch of rough ice. She slows steadily, then continues on at 6.0 m/s. What is her acceleration on the rough ice?
Read more -
Chapter : Problem 31 College Physics 12
Problem 31P A small propeller airplane can comfortably achieve a high enough speed to take off on a runway that is 1/4 mile long. A large, fully loaded passenger jet has about the same acceleration from rest, but it needs to achieve twice the speed to take off. What is the minimum runway length that will serve? Hint: You can solve this problem using ratios without having any additional information.
Read more -
Chapter : Problem 32 College Physics 12
Problem 32P Figure P2.34 shows a velocity-versus-time graph for a particle moving along the x-axis. At t = 0 s, assume that x = 0 m. a. What are the particle’s position, velocity, and acceleration at t = 1.0 s? b. What are the particle’s position, velocity, and acceleration at t = 3.0 s?
Read more -
Chapter : Problem 33 College Physics 12
Problem 33P A driver has a reaction time of 0.50 s, and the maximum deceleration of her car is . She is driving at 20 m/s when suddenly she sees an obstacle in the road 50 m in front of her. Can she stop the car in time to avoid a collision?
Read more -
Chapter : Problem 34 College Physics 12
Problem 34P Chameleons catch insects with their tongues, which they can rapidly extend to great lengths. In a typical strike, the chameleon’s tongue accelerates at a remarkable for 20 ms, then travels at constant speed for another 30 ms. During this total time of 50 ms, 1/20 of a second, how far does the tongue reach?
Read more -
Chapter : Problem 35 College Physics 12
Problem 35P You’re driving down the highway late one night at 20 m/s when a deer steps onto the road 35 m in front of you. Your reaction time before stepping on the brakes is 0.50 s, and the maximum deceleration of your car is . a. How much distance is between you and the deer when you come to a stop? b. What is the maximum speed you could have and still not hit the deer?
Read more -
Chapter : Problem 36 College Physics 12
Problem 36P A light-rail train going from one station to the next on a straight section of track accelerates from rest at for 20 s. It then proceeds at constant speed for 1100 m before slowing down at until it stops at the station. a. What is the distance between the stations? b. How much time does it take the train to go between the stations?
Read more -
Chapter : Problem 37 College Physics 12
Problem 37P A simple model for a person running the 100m dash is to assume the sprinter runs with constant acceleration until reaching top speed, then maintains that speed through the finish line. If a sprinter reaches his top speed of 11.2 m/s in 2.14 s, what will be his total time?
Read more -
Chapter : Problem 38 College Physics 12
Problem 38P Ball bearings can be made by letting spherical drops of molten metal fall inside a tall tower—called a shot tower—and solidify as they fall. a. If a bearing needs 4.0 s to solidify enough for impact, how high must the tower be? b. What is the bearing’s impact velocity?
Read more -
Chapter : Problem 39 College Physics 12
Problem 39P In the chapter, we saw that a person’s reaction time is generally not quick enough to allow the person to catch a dollar bill dropped between the fingers. If a typical reaction time in this case is 0.25 s, how long would a bill need to be for a person to have a good chance of catching it?
Read more -
Chapter : Problem 40 College Physics 12
Problem 40P A ball is thrown vertically upward with a speed of 19.6 m/s. a. What are the ball’s velocity and height after 1.00, 2.00, 3.00, and 4.00 s? b. Draw the ball’s velocity-versus-time graph. Give both axes an appropriate numerical scale.
Read more -
Chapter : Problem 41 College Physics 12
Problem 41P A student at the top of a building of height h throws ball A straight upward with speed and throws ball B straight downward with the same initial speed. a. Compare the balls’ accelerations, both direction and magnitude, immediately after they leave her hand. Is one acceleration larger than the other? Or are the magnitudes equal? b. Compare the final speeds of the balls as they reach the ground. Is one larger than the other? Or are they equal?
Read more -
Chapter : Problem 42 College Physics 12
Problem 42P Excellent human jumpers can leap straight up to a height of 110 cm off the ground. To reach this height, with what speed would a person need to leave the ground?
Read more -
Chapter : Problem 43 College Physics 12
Problem 43P A football is kicked straight up into the air; it hits the ground 5.2 s later. a. What was the greatest height reached by the ball? Assume it is kicked from ground level. b. With what speed did it leave the kicker’s foot?
Read more -
Chapter : Problem 44 College Physics 12
Problem 44P In an action movie, the villain is rescued from the ocean by grabbing onto the ladder hanging from a helicopter. He is so intent on gripping the ladder that he lets go of his briefcase of counterfeit money when he is 130 m above the water. If the briefcase hits the water 6.0 s later, what was the speed at which the helicopter was ascending?
Read more -
Chapter : Problem 45 College Physics 12
Problem 45P A rock climber stands on top of a 50-m-high cliff overhanging a pool of water. He throws two stones vertically downward 1.0 s apart and observes that they cause a single splash. The initial speed of the first stone was 2.0 m/s. a. How long after the release of the first stone does the second stone hit the water? b. What was the initial speed of the second stone? c. What is the speed of each stone as it hits the water?
Read more -
Chapter : Problem 46 College Physics 12
Problem 46GP Actual velocity data for a lion pursuing prey are shown in Figure P2.52. Estimate: a. The initial acceleration of the lion. b. The acceleration of the lion at 2 s and at 4 s. c. The distance traveled by the lion between 0 s and 8 s.
Read more -
Chapter : Problem 47 College Physics 12
Problem 47GP Problems concern nerve impulses, electrical signals propagated along nerve fibers consisting of many axons (fiber like extensions of nerve cells) connected end-to-end. Axons come in two varieties: insulated axons with a sheath made of myelin, and uninsulated axons with no such sheath. Myelinated (sheathed) axons conduct nerve impulses much faster than unmyelinated (unsheathed) axons. The impulse speed depends on the diameter of the axons and the sheath, but a typical myelinated axon transmits nerve impulses at a speed of about 25 m/s, much faster than the typical 2.0 m/s for an unmyelinated axon. Figure 47 shows small portions of three nerve fibers consisting of axons of equal size. Two-thirds of the axons in fiber B are myelinated. Suppose nerve impulses simultaneously enter the left side of the nerve fibers sketched in Figure 47, then propagate to the right. Draw qualitatively accurate position and velocity graphs for the nerve impulses in all three cases. A nerve fiber is made up of many axons, but show the propagation of the impulses only over the six axons shown here.
Read more -
Chapter : Problem 48 College Physics 12
Problem 48GP Problems concern nerve impulses, electrical signals propagated along nerve fibers consisting of many axons (fiber like extensions of nerve cells) connected end-to-end. Axons come in two varieties: insulated axons with a sheath made of myelin, and uninsulated axons with no such sheath. Myelinated (sheathed) axons conduct nerve impulses much faster than unmyelinated (unsheathed) axons. The impulse speed depends on the diameter of the axons and the sheath, but a typical myelinated axon transmits nerve impulses at a speed of about 25 m/s, much faster than the typical 2.0 m/s for an unmyelinated axon. Figure 47 shows small portions of three nerve fibers consisting of axons of equal size. Two-thirds of the axons in fiber B are myelinated. Suppose that the nerve fibers in Figure 47 connect a finger to your brain, a distance of 1.2 m. a. What are the travel times of a nerve impulse from finger to brain along fibers A and C? b. For fiber B, 2/3 of the length is composed of myelinated axons, 1/3 unmyelinated axons. Compute the travel time for a nerve impulse on this fiber. c. When you touch a hot stove with your finger, the sensation of pain must reach your brain as a nerve signal along a nerve fiber before your muscles can react. Which of the three fibers gives you the best protection against a burn? Are any of these fibers unsuitable for transmitting urgent sensory information?
Read more -
Chapter : Problem 49 College Physics 12
Problem 49GP A truck driver has a shipment of apples to deliver to a destination 440 miles away. The trip usually takes him 8 hours. Today he finds himself daydreaming and realizes 120 miles into his trip that he is running 15 minutes later than his usual pace at this point. At what speed must he drive for the remainder of the trip to complete the trip in the usual amount of time?
Read more -
Chapter : Problem 50 College Physics 12
Problem 50GP When you sneeze, the air in your lungs accelerates from rest to approximately 150 km/h in about 0.50 seconds. a. What is the acceleration of the air in ? b. What is this acceleration, in units of g?
Read more -
Chapter : Problem 51 College Physics 12
Problem 51GP Figure P2.55 shows the motion diagram, made at two frames of film per second, of a ball rolling along a track. The track has a 3.0-m-long sticky section. a. Use the scale to determine the positions of the center of the ball. Place your data in a table, similar to Table 2.1, showing each position and the instant of time at which it occurred. b. Make a graph of x versus t for the ball. Because you have data only at certain instants of time, your graph should consist of dots that are not connected together. c. What is the change in the ball’s position from t = 0 s to t = 1.0 s? d. What is the change in the ball’s position from t = 2.0 s to t = 4.0 s? e. What is the ball’s velocity before reaching the sticky section? f. What is the ball’s velocity after passing the sticky section? g. Determine the ball’s acceleration on the sticky section of the track.
Read more -
Chapter : Problem 52 College Physics 12
Problem 52GP Julie drives 100 mi to Grandmother’s house. On the way to Grandmother’s, Julie drives half the distance at 40 mph and half the distance at 60 mph. On her return trip, she drives half the time at 40 mph and half the time at 60 mph. a. How long does it take Julie to complete the trip to Grandmother’s house? b. How long does the return trip take?
Read more -
Chapter : Problem 53 College Physics 12
Problem 53GP The takeoff speed for an Airbus A320 jetliner is 80 m/s. Velocity data measured during takeoff are as shown in the table. a. What is the takeoff speed in miles per hour? b. What is the jetliner’s acceleration during takeoff? c. At what time do the wheels leave the ground? d. For safety reasons, in case of an aborted takeoff, the runway must be three times the takeoff distance. Can an A320 take off safely on a 2.5-mi-long runway? t(s) vx(m/s) 0 0 10 23 20 46 30 69
Read more -
Chapter : Problem 54 College Physics 12
Problem 54GP Does a real automobile have constant acceleration? Measured data for a Porsche 944 Turbo at maximum acceleration are as shown in the table. a. Convert the velocities to m/s, then make a graph of velocity versus time. Based on your graph, is the acceleration constant? Explain. b. Draw a smooth curve through the points on your graph, then use your graph to estimate the car’s acceleration at 2.0 s and 8.0 s. Give your answer in SI units. Hint: Remember that acceleration is the slope of the velocity graph.
Read more -
Chapter : Problem 55 College Physics 12
Problem 55GP People hoping to travel to other worlds are faced with huge challenges. One of the biggest is the time required for a journey. The nearest star is away. Suppose you had a spacecraft that could accelerate at 1.0g for half a year, then continue at a constant speed. (This is far beyond what can be achieved with any known technology.) How long would it take you to reach the nearest star to earth?
Read more -
Chapter : Problem 56 College Physics 12
Problem 56GP You are driving to the grocery store at 20 m/s. You are 110 m from an intersection when the traffic light turns red. Assume that your reaction time is 0.70 s and that your car brakes with constant acceleration. a. How far are you from the intersection when you begin to apply the brakes? b. What acceleration will bring you to rest right at the intersection? c. How long does it take you to stop?
Read more -
Chapter : Problem 57 College Physics 12
Problem 57GP When you blink your eye, the upper lid goes from rest with your eye open to completely covering your eye in a time of 0.024 s. a. Estimate the distance that the top lid of your eye moves during a blink. b. What is the acceleration of your eyelid? Assume it to be constant. c. What is your upper eyelid’s final speed as it hits the bottom eyelid?
Read more -
Chapter : Problem 58 College Physics 12
A bush baby, an African primate, is capable of a remarkable vertical leap. The bush baby goes into a crouch and extends its legs, pushing upward for a distance of 0.16 m. After this upward acceleration, the bush baby leaves the ground and travels upward for 2.3 m. What is the acceleration during the pushing-off phase? Give your answer in \(\mathrm{m} / \mathrm{s}^{2}\) and in g’s.
Read more -
Chapter : Problem 59 College Physics 12
Problem 59GP When jumping, a flea reaches a takeoff speed of 1.0 m/s over a distance of 0.50 mm. a. What is the flea’s acceleration during the jump phase? b. How long does the acceleration phase last? c. If the flea jumps straight up, how high will it go? (Ignore air resistance for this problem; in reality, air resistance plays a large role, and the flea will not reach this height.)
Read more -
Chapter : Problem 60 College Physics 12
Problem 60GP Certain insects can achieve seemingly impossible accelerations while jumping. The click beetle accelerates at an astonishing 400g over a distance of 0.60 cm as it rapidly bends its thorax, making the “click” that gives it its name. a. Assuming the beetle jumps straight up, at what speed does it leave the ground? b. How much time is required for the beetle to reach this speed? c. Ignoring air resistance, how high would it go?
Read more -
Chapter : Problem 61 College Physics 12
Problem 61GP Divers compete by diving into a 3.0-m-deep pool from a platform 10 m above the water. What is the magnitude of the minimum acceleration in the water needed to keep a diver from hitting the bottom of the pool? Assume the acceleration is constant.
Read more -
Chapter : Problem 62 College Physics 12
Problem 62GP A student standing on the ground throws a ball straight up. The ball leaves the student’s hand with a speed of 15 m/s when the hand is 2.0 m above the ground. How long is the ball in the air before it hits the ground? (The student moves her hand out of the way.)
Read more -
Chapter : Problem 63 College Physics 12
Problem 63GP A rock is tossed straight up with a speed of 20 m/s. When it returns, it falls into a hole 10 m deep. a. What is the rock’s velocity as it hits the bottom of the hole? b. How long is the rock in the air, from the instant it is released until it hits the bottom of the hole?
Read more -
Chapter : Problem 64 College Physics 12
Problem 64GP A 200 kg weather rocket is loaded with 100 kg of fuel and fired straight up. It accelerates upward at for 30.0 s, then runs out of fuel. Ignore any air resistance effects. a. What is the rocket’s maximum altitude? b. How long is the rocket in the air? c. Draw a velocity-versus-time graph for the rocket from liftoff until it hits the ground.
Read more -
Chapter : Problem 65 College Physics 12
Problem 65GP A juggler throws a ball straight up into the air with a speed of 10 m/s. With what speed would she need to throw a second ball half a second later, starting from the same position as the first, in order to hit the first ball at the top of its trajectory?
Read more -
Chapter : Problem 66 College Physics 12
Problem 66GP A hotel elevator ascends 200 m with a maximum speed of 5.0 m/s. Its acceleration and deceleration both have a magnitude of . a. How far does the elevator move while accelerating to full speed from rest? b. How long does it take to make the complete trip from bottom to top?
Read more -
Chapter : Problem 67 College Physics 12
Problem 67GP A car starts from rest at a stop sign. It accelerates at for 6.0 seconds, coasts for 2.0 s, and then slows down at a rate of for the next stop sign. How far apart are the stop signs?
Read more -
Chapter : Problem 68 College Physics 12
Problem 68GP A toy train is pushed forward and released at with a speed of 2.0 m/s. It rolls at a steady speed for 2.0 s, then one wheel begins to stick. The train comes to a stop 6.0 m from the point at which it was released. What is the train’s acceleration after its wheel begins to stick?
Read more -
Chapter : Problem 69 College Physics 12
Problem 69GP Heather and Jerry are standing on a bridge 50 m above a river. Heather throws a rock straight down with a speed of 20 m/s. Jerry, at exactly the same instant of time, throws a rock straight up with the same speed. Ignore air resistance. a. How much time elapses between the first splash and the second splash? b. Which rock has the faster speed as it hits the water?
Read more -
Chapter : Problem 70 College Physics 12
Problem 70GP A motorist is driving at 20 m/s when she sees that a traffic light 200 m ahead has just turned red. She knows mat this light stays red for 15 s, and she wants to reach the light just as it turns green again. It takes her 1.0 s to step on the brakes and begin slowing at a constant deceleration. What is her speed as she reaches the light at the instant it turns green?
Read more -
Chapter : Problem 71 College Physics 12
Problem 71GP A “rocket car” is launched along a long straight track at t = 0 s. It moves with constant acceleration a1 = 2.0 m/s2. At t = 2.0 s, a second car is launched along a parallel track, from the same starting point, with constant acceleration a2 = 8.0 m/s2. a. At what time does the second car catch up with the first one? b. How far have the cars traveled when the second passes the first?
Read more -
Chapter : Problem 72 College Physics 12
Problem 72GP A Porsche challenges a Honda to a 400 m race. Because the Porsche’s acceleration of 3.5 m/s2 is larger than the Honda’s 3.0 m/s2, the Honda gets a 50-m head start. Assume, somewhat unrealistically, that both cars can maintain these accelerations the entire distance. Who wins, and by how much time?
Read more -
Chapter : Problem 73 College Physics 12
Problem 73GP The minimum stopping distance for a car traveling at a speed of 30 m/s is 60 m, including the distance traveled during the driver’s reaction time of 0.50 s. a. What is the minimum stopping distance for the same car traveling at a speed of 40 m/s? b. Draw a position-versus-time graph for die motion of the car in part a. Assume the car is at xi= 0 m when the driver first sees the emergency situation ahead that calls for a rapid halt.
Read more -
Chapter : Problem 74 College Physics 12
Problem 74GP A rocket is launched straight up with constant acceleration. Four seconds after liftoff, a bolt falls off the side of the rocket. The bolt hits the ground 6.0 s later. What was the rocket’s acceleration?
Read more -
Chapter : Problem 75 College Physics 12
Problem 75PP Free Fall on Different Worlds Objects in free fall on the earth have acceleration . On the moon, free-fall acceleration is approximately 1/6 of the acceleration on earth. This changes the scale of problems involving free fall. For instance, suppose you jump straight upward, leaving the ground with velocity and then steadily slowing until reaching zero velocity at your highest point. Because your initial velocity is determined mostly by the strength of your leg muscles, we can assume your initial velocity would be the same on the moon. But considering the final equation in Synthesis 2.1 we can see that, with a smaller free-fall acceleration, your maximum height would be greater. The following questions ask you to think about how certain athletic feats might be performed in this reduced-gravity environment. If an astronaut can jump straight up to a height of 0.50 m on earth, how high could he jump on the moon? A. 1.2 m B. 3.0 m C. 3.6 m D. 18 m
Read more -
Chapter : Problem 76 College Physics 12 Read more
-
Chapter : Problem 77 College Physics 12 Read more
-
Chapter : Problem 26 College Physics 12
Problem 26P A Thomson’s gazelle can reach a speed of 13 m/s in 3.0 s. A lion can reach a speed of 9.5 m/s in 1.0 s. A trout can reach a speed of 2.8 m/s in 0.12 s. Which animal has the largest acceleration?
Read more