Solution Found!
The Bode plots for a plant, G(s), used in a unity feedback
Chapter 10, Problem 26(choose chapter or problem)
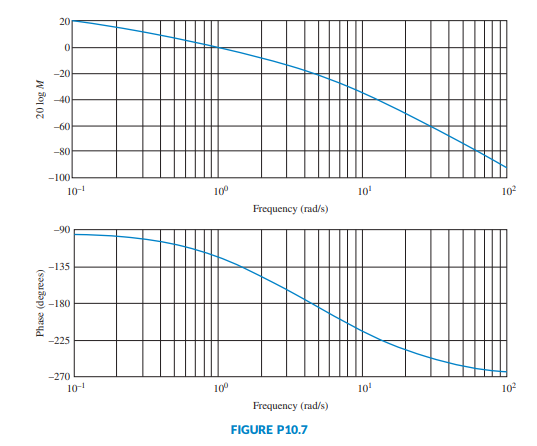
The Bode plots for a plant, G(s), used in a unity feedback system are shown in Figure P10.7. Do the following:
a. Find the gain margin, phase margin, zero dB frequency, \(180^{\circ}\) frequency, and the closed-loop bandwidth.
b. Use your results in Part a to estimate the damping ratio, percent overshoot, settling time, and peak time.
Questions & Answers
QUESTION:
The Bode plots for a plant, G(s), used in a unity feedback system are shown in Figure P10.7. Do the following:
a. Find the gain margin, phase margin, zero dB frequency, \(180^{\circ}\) frequency, and the closed-loop bandwidth.
b. Use your results in Part a to estimate the damping ratio, percent overshoot, settling time, and peak time.
Step 1 of 4
a)
Let’s draw the bode diagram as,

Consider the phase plot where it crosses 180° and determine the magnitude at that Frequency. Thus, the gain margin is,
GM = 20 - 0 = 20 dB
Therefore, the gain margin is 20 dB.