
Problem 23PE Problem (a) A light-rail commuter train accelerates at a rate of 1.35 m/s2 . How long does it take to reach its top speed of 80.0 km/h, starting from rest? (b) The same train ordinarily decelerates at a rate of 1.65 m/s2 . How long does it take to come to a stop from its top speed? (c) In emergencies the train can decelerate more rapidly, coming to rest from 80.0 km/h in 8.30 s. What is its emergency deceleration in m/s2?
Read moreTable of Contents
1
Introduction: The Nature of Science and Physics
2
Kinematics
3
Two-Dimensional Kinematics
4
Dynamics: Force and Newton's Laws of Motion
5
Further Applications of Newton's Laws: Friction, Drag, and Elasticity
6
Uniform Circular Motion and Gravitation
7
Work, Energy, and Energy Resources
8
Linear Momentum and Collisions
9
Statics and Torque
10
Rotational Motion and Angular Momentum
11
Fluid Statics
12
Fluid Dynamics and its Biological and Medical Applications
13
Temperature, Kinetic Theory, and the Gas Laws
14
Heat and Heat Transfer Methods
15
Thermodynamics
16
Oscillatory Motion and Waves
17
Physics of Hearing
18
Electric Charge and Electric Field
19
Electric Potential and Electric Field
20
Electric Current, Resistance, and Ohm's Law
21
Circuits and DC Instruments
22
Magnetism
23
Electromagnetic Induction, AC Circuits, and Electrical Technologies
24
Electromagnetic Waves
25
Geometric Optics
26
Vision and Optical Instruments
27
Wave Optics
28
Special Relativity
29
Introduction to Quantum Physics
30
Atomic Physics
31
Radioactivity and Nuclear Physics
32
Medical Applications of Nuclear Physics
33
Particle Physics
34
Frontiers of Physics
Textbook Solutions for College Physics
Chapter 2 Problem 66
Question
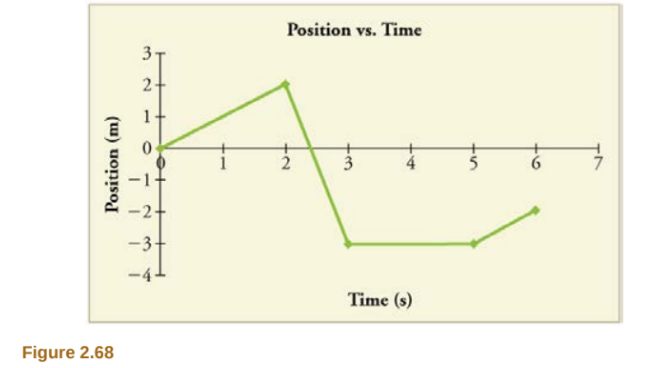
Figure 2.68 shows the displacement graph for a particle for \(5 \ s\). Draw the corresponding velocity and acceleration graphs.
Solution
Step 1 of 5
The rate of change of position is called velocity. It is denoted by v.
v = ds/dt
Here, ds is the change in the position, and dt is the change in the time.
The rate of change of velocity is called acceleration. It is denoted by a.
a = dv/dt
Here, dv is the change in the velocity.
Step 2 of 5
The below figure indicates the graph between the position and time as follows:
The time and corresponding position from the graph are tabulated below as,
\(\begin{array}{|c|c|} \hline \text { time }(\mathrm{s}) & \m
Subscribe to view the
full solution
full solution
Title
College Physics 1
Author
Paul Peter Urone, Roger Hinrichs
ISBN
9781938168000
Solved: Figure 2.68 shows the displacement graph for a
Chapter 2 textbook questions
-
Chapter 2: Problem 23 College Physics 1
-
Chapter 2: Problem 66 College Physics 1
Figure 2.68 shows the displacement graph for a particle for \(5 \ s\). Draw the corresponding velocity and acceleration graphs. Equation Transcription: Text Transcription: 5 s
Read more -
Chapter 2: Problem 1 College Physics 1
Problem 1CQ Give an example in which there are clear distinctions among distance traveled, displacement, and magnitude of displacement. Specifically identify each quantity in your example.
Read more -
Chapter 2: Problem 1 College Physics 1
Find the following for path \(A\) in Figure 2.59: (a) The distance traveled. (b) The magnitude of the displacement from start to finish. (c) The displacement from start to finish. Equation Transcription: Text Transcription: A
Read more -
Chapter 2: Problem 2 College Physics 1
Problem 2CQ Under what circumstances does distance traveled equal magnitude of displacement? What is the only case in which magnitude of displacement and displacement are exactly the same?
Read more -
Chapter 2: Problem 2 College Physics 1
Find the following for path \(B\) in Figure 2.59: (a) The distance traveled. (b) The magnitude of the displacement from start to finish. (c) The displacement from start to finish. Equation Transcription: Text Transcription: B
Read more -
Chapter 2: Problem 3 College Physics 1
Problem 3CQ Bacteria move back and forth by using their flagella (structures that look like little tails). Speeds of up to 50 ?m/s (50×10?6 m/s) have been observed. The total distance traveled by a bacterium is large for its size, while its displacement is small. Why is this?
Read more -
Chapter 2: Problem 3 College Physics 1
Find the following for path \(C\) in Figure 2.59: (a) The distance traveled. (b) The magnitude of the displacement from start to finish. (c) The displacement from start to finish. Equation Transcription: Text Transcription: C
Read more -
Chapter 2: Problem 4 College Physics 1
Problem 4CQ A student writes, “A bird that is diving for prey has a speed of ? 10 m /s .” What is wrong with the student’s statement? What has the student actually described? Explain.
Read more -
Chapter 2: Problem 4 College Physics 1
Find the following for path \(D\) in Figure 2.59: (a) The distance traveled. (b) The magnitude of the displacement from start to finish. (c) The displacement from start to finish. Equation Transcription: Text Transcription: D
Read more -
Chapter 2: Problem 5 College Physics 1
Problem 5PE (a) Calculate Earth’s average speed relative to the Sun. (b) What is its average velocity over a period of one year?
Read more -
-
Chapter 2: Problem 6 College Physics 1
Problem 6CQ Acceleration is the change in velocity over time. Given this information, is acceleration a vector or a scalar quantity? Explain.
Read more -
Chapter 2: Problem 6 College Physics 1
Problem 6PE A helicopter blade spins at exactly 100 revolutions per minute. Its tip is 5.00 m from the center of rotation. (a) Calculate the average speed of the blade tip in the helicopter’s frame of reference. (b) What is its average velocity over one revolution?
Read more -
Chapter 2: Problem 7 College Physics 1
Problem 7CQ A weather forecast states that the temperature is predicted to be ?5ºC the following day. Is this temperature a vector or a scalar quantity? Explain.
Read more -
Chapter 2: Problem 7 College Physics 1
Problem 7PE The North American and European continents are moving apart at a rate of about 3 cm/y. At this rate how long will it take them to drift 500 km farther apart than they are at present?
Read more -
Chapter 2: Problem 8 College Physics 1
Problem 8CQ Give an example (but not one from the text) of a device used to measure time and identify what change in that device indicates a change in time.
Read more -
Chapter 2: Problem 8 College Physics 1
Land west of the San Andreas fault in southern California is moving at an average velocity of about 6 cm/y northwest relative to land east of the fault. Los Angeles is west of the fault and may thus someday be at the same latitude as San Francisco, which is east of the fault. How far in the future will this occur if the displacement to be made is 590 km northwest, assuming the motion remains constant?
Read more -
Chapter 2: Problem 9 College Physics 1
Problem 9CQ There is a distinction between average speed and the magnitude of average velocity. Give an example that illustrates the difference between these two quantities.
Read more -
Chapter 2: Problem 9 College Physics 1
Problem 9PE On May 26, 1934, a streamlined, stainless steel diesel train called the Zephyr set the world’s nonstop long-distance speed record for trains. Its run from Denver to Chicago took 13 hours, 4 minutes, 58 seconds, and was witnessed by more than a million people along the route. The total distance traveled was 1633.8 km. What was its average speed in km/h and m/s?
Read more -
Chapter 2: Problem 10 College Physics 1
Problem 10CQ Does a car’s odometer measure position or displacement? Does its speedometer measure speed or velocity?
Read more -
Chapter 2: Problem 10 College Physics 1
Problem 10PE Tidal friction is slowing the rotation of the Earth. As a result, the orbit of the Moon is increasing in radius at a rate of approximately 4 cm/year. Assuming this to be a constant rate, how many years will pass before the radius of the Moon’s orbit increases by 3.84×10⁶ m (1%)?
Read more -
Chapter 2: Problem 11 College Physics 1
Problem 11CQ If you divide the total distance traveled on a car trip (as determined by the odometer) by the time for the trip, are you calculating the average speed or the magnitude of the average velocity? Under what circumstances are these two quantities the same?
Read more -
Chapter 2: Problem 11 College Physics 1
Problem 11PE A student drove to the university from her home and noted that the odometer reading of her car increased by 12.0 km. The trip took 18.0 min. (a) What was her average speed? (b) If the straight-line distance from her home to the university is 10.3 km in a direction 25.0º south of east, what was her average velocity? (c) If she returned home by the same path 7 h 30 min after she left, what were her average speed and velocity for the entire trip?
Read more -
Chapter 2: Problem 12 College Physics 1
Problem 12CQ How are instantaneous velocity and instantaneous speed related to one another? How do they differ?
Read more -
Chapter 2: Problem 12 College Physics 1
Problem 12PE The speed of propagation of the action potential (an electrical signal) in a nerve cell depends (inversely) on the diameter of the axon (nerve fiber). If the nerve cell connecting the spinal cord to your feet is 1.1 m long, and the nerve impulse speed is 18 m/s, how long does it take for the nerve signal to travel this distance?
Read more -
Chapter 2: Problem 13 College Physics 1
Problem 13CQ Is it possible for speed to be constant while acceleration is not zero? Give an example of such a situation.
Read more -
Chapter 2: Problem 13 College Physics 1
Problem 13PE Conversations with astronauts on the lunar surface were characterized by a kind of echo in which the earthbound person’s voice was so loud in the astronaut’s space helmet that it was picked up by the astronaut’s microphone and transmitted back to Earth. It is reasonable to assume that the echo time equals the time necessary for the radio wave to travel from the Earth to the Moon and back (that is, neglecting any time delays in the electronic equipment). Calculate the distance from Earth to the Moon given that the echo time was 2.56 s and that radio waves travel at the speed of light (3.00×10⁸ m/s) .
Read more -
Chapter 2: Problem 14 College Physics 1
Problem 14CQ Is it possible for velocity to be constant while acceleration is not zero? Explain.
Read more -
Chapter 2: Problem 14 College Physics 1
Problem 14PE A football quarterback runs 15.0 m straight down the playing field in 2.50 s. He is then hit and pushed 3.00 m straight backward in 1.75 s. He breaks the tackle and runs straight forward another 21.0 m in 5.20 s. Calculate his average velocity (a) for each of the three intervals and (b) for the entire motion.
Read more -
Chapter 2: Problem 15 College Physics 1
Problem 15CQ Give an example in which velocity is zero yet acceleration is not
Read more -
Chapter 2: Problem 15 College Physics 1
Problem 15PE The planetary model of the atom pictures electrons orbiting the atomic nucleus much as planets orbit the Sun. In this model you can view hydrogen, the simplest atom, as having a single electron in a circular orbit 1.06×10?10 m in diameter. (a) If the average speed of the electron in this orbit is known to be 2.20×10⁶ m/s , calculate the number of revolutions per second it makes about the nucleus. (b) What is the electron’s average velocity?
Read more -
Chapter 2: Problem 16 College Physics 1
Problem 16CQ If a subway train is moving to the left (has a negative velocity) and then comes to a stop, what is the direction of its acceleration? Is the acceleration positive or negative?
Read more -
Chapter 2: Problem 16 College Physics 1
Problem 16PE A cheetah can accelerate from rest to a speed of 30.0 m/s in 7.00 s. What is its acceleration?
Read more -
Chapter 2: Problem 17 College Physics 1
Problem 17CQ Plus and minus signs are used in one-dimensional motion to indicate direction. What is the sign of an acceleration that reduces the magnitude of a negative velocity? Of a positive velocity?
Read more -
Chapter 2: Problem 17 College Physics 1
Problem 17PE Professional Application Dr. John Paul Stapp was U.S. Air Force officer who studied the effects of extreme deceleration on the human body. On December 10, 1954, Stapp rode a rocket sled, accelerating from rest to a top speed of 282 m/s (1015 km/h) in 5.00 s, and was brought jarringly back to rest in only 1.40 s! Calculate his (a) acceleration and (b) deceleration. Express each in multiples of g (9.80 m/s2 ) by taking its ratio to the acceleration of gravity.
Read more -
Chapter 2: Problem 18 College Physics 1
Problem 18CQ What information do you need in order to choose which equation or equations to use to solve a problem? Explain.
Read more -
Chapter 2: Problem 18 College Physics 1
Problem 18PE A commuter backs her car out of her garage with an acceleration of 1.40 m/s2 . (a) How long does it take her to reach a speed of 2.00 m/s? (b) If she then brakes to a stop in 0.800 s, what is her deceleration?
Read more -
Chapter 2: Problem 19 College Physics 1
Problem 19CQ What is the last thing you should do when solving a problem? Explain.
Read more -
Chapter 2: Problem 19 College Physics 1
Problem 19PE Assume that an intercontinental ballistic missile goes from rest to a suborbital speed of 6.50 km/s in 60.0 s (the actual speed and time are classified). What is its average acceleration in m/s2 and in multiples of g (9.80 m/s2 )?
Read more -
Chapter 2: Problem 20 College Physics 1
Problem 20CQ What is the acceleration of a rock thrown straight upward on the way up? At the top of its flight? On the way down?
Read more -
Chapter 2: Problem 20 College Physics 1
Problem 20PE An Olympic-class sprinter starts a race with an acceleration of 4.50 m/s2 . (a) What is her speed 2.40 s later? (b) Sketch a graph of her position vs. time for this period.
Read more -
Chapter 2: Problem 21 College Physics 1
Problem 21CQ An object that is thrown straight up falls back to Earth. This is one-dimensional motion. (a) When is its velocity zero? (b) Does its velocity change direction? (c) Does the acceleration due to gravity have the same sign on the way up as on the way down?
Read more -
Chapter 2: Problem 21 College Physics 1
Problem 21PE A well-thrown ball is caught in a well-padded mitt. If the deceleration of the ball is 2.10×10⁴ m/s2 , and 1.85 ms (1 ms = 10?3 s) elapses from the time the ball first touches the mitt until it stops, what was the initial velocity of the ball?
Read more -
Chapter 2: Problem 22 College Physics 1
Suppose you throw a rock nearly straight up at a coconut in a palm tree, and the rock misses on the way up but hits the coconut on the way down. Neglecting air resistance, how does the speed of the rock when it hits the coconut on the way down compare with what it would have been if it had hit the coconut on the way up? Is it more likely to dislodge the coconut on the way up or down? Explain.
Read more -
Chapter 2: Problem 22 College Physics 1
Problem 22PE A bullet in a gun is accelerated from the firing chamber to the end of the barrel at an average rate of 6.20×10⁵ m/s2 for 8.10×10?4 s . What is its muzzle velocity (that is, its final velocity)?
Read more -
Chapter 2: Problem 23 College Physics 1
Problem 23CQ If an object is thrown straight up and air resistance is negligible, then its speed when it returns to the starting point is the same as when it was released. If air resistance were not negligible, how would its speed upon return compare with its initial speed? How would the maximum height to which it rises be affected?
Read more -
Chapter 2: Problem 23 College Physics 1
Problem 23PE (a) A light-rail commuter train accelerates at a rate of 1.35 m/s2 . How long does it take to reach its top speed of 80.0 km/h, starting from rest? (b) The same train ordinarily decelerates at a rate of 1.65 m/s2 . How long does it take to come to a stop from its top speed? (c) In emergencies the train can decelerate more rapidly, coming to rest from 80.0 km/h in 8.30 s. What is its emergency deceleration in m/s2 ?
Read more -
Chapter 2: Problem 24 College Physics 1
Problem 24CQ The severity of a fall depends on your speed when you strike the ground. All factors but the acceleration due to gravity being the same, how many times higher could a safe fall on the Moon be than on Earth (gravitational acceleration on the Moon is about 1/6 that of the Earth)?
Read more -
Chapter 2: Problem 24 College Physics 1
Problem 24PE While entering a freeway, a car accelerates from rest at a rate of 2.40 m/s2 for 12.0 s. (a) Draw a sketch of the situation. (b) List the knowns in this problem. (c) How far does the car travel in those 12.0 s? To solve this part, first identify the unknown, and then discuss how you chose the appropriate equation to solve for it. After choosing the equation, show your steps in solving for the unknown, check your units, and discuss whether the answer is reasonable. (d) What is the car’s final velocity? Solve for this unknown in the same manner as in part (c), showing all steps explicitly.
Read more -
Chapter 2: Problem 25 College Physics 1
Problem 25PE At the end of a race, a runner decelerates from a velocity of 9.00 m/s at a rate of 2.00 m/s2 . (a) How far does she travel in the next 5.00 s? (b) What is her final velocity? (c) Evaluate the result. Does it make sense?
Read more -
Chapter 2: Problem 25 College Physics 1
How many times higher could an astronaut jump on the Moon than on Earth if his takeoff speed is the same in both locations (gravitational acceleration on the Moon is about 1/6 of g on Earth)?
Read more -
Chapter 2: Problem 26 College Physics 1
(a) Explain how you can use the graph of position versus time in Figure 2.54 to describe the change in velocity over time. Identify (b) the time (\(t_{a}\), \(t_{b}\), \(t_{c}\), \(t_{d}\), or \(t_{e}\)) at which the instantaneous velocity is greatest, (c) the time at which it is zero, and (d) the time at which it is negative. Equation Transcription: Text Transcription: t_a t_b t_c t_d t_e
Read more -
Chapter 2: Problem 26 College Physics 1
Problem 26PE Professional Application: Blood is accelerated from rest to 30.0 cm/s in a distance of 1.80 cm by the left ventricle of the heart. (a) Make a sketch of the situation. (b) List the knowns in this problem. (c) How long does the acceleration take? To solve this part, first identify the unknown, and then discuss how you chose the appropriate equation to solve for it. After choosing the equation, show your steps in solving for the unknown, checking your units. (d) Is the answer reasonable when compared with the time for a heartbeat?
Read more -
Chapter 2: Problem 27 College Physics 1
(a) Sketch a graph of velocity versus time corresponding to the graph of displacement versus time given in Figure 2.55. (b) Identify the time or times (\(t_{a}\), \(t_{b}\), \(t_{c}\), etc.) at which the instantaneous velocity is greatest. (c) At which times is it zero? (d) At which times is it negative? Equation Transcription: Text Transcription: t_a t_b t_c
Read more -
Chapter 2: Problem 27 College Physics 1
Problem 27PE In a slap shot, a hockey player accelerates the puck from a velocity of 8.00 m/s to 40.0 m/s in the same direction. If this shot takes 3.33×10?2 s , calculate the distance over which the puck accelerates.
Read more -
Chapter 2: Problem 28 College Physics 1
(a) Explain how you can determine the acceleration over time from a velocity versus time graph such as the one in Figure 2.56. (b) Based on the graph, how does acceleration change over time?
Read more -
Chapter 2: Problem 28 College Physics 1
Problem 28PE A powerful motorcycle can accelerate from rest to 26.8 m/ s (100 km/h) in only 3.90 s. (a) What is its average acceleration? (b) How far does it travel in that time?
Read more -
Chapter 2: Problem 29 College Physics 1
(a) Sketch a graph of acceleration versus time corresponding to the graph of velocity versus time given in Figure \(2.57\). (b) Identify the time or times \(\left(t_{a_{2},} t_{b}, t_{c}, \text { etc. }\right)\) at which the acceleration is greatest. (c) At which times is it zero? (d) At which times is it negative? Equation Transcription: Text Transcription: 2.57 (t_a, t_b, t_c, etc.)
Read more -
Chapter 2: Problem 29 College Physics 1
Problem 29PE Freight trains can produce only relatively small accelerations and decelerations. (a) What is the final velocity of a freight train that accelerates at a rate of 0.0500 m/s2 for 8.00 min, starting with an initial velocity of 4.00 m/s? (b) If the train can slow down at a rate of 0.550 m/s2 , how long will it take to come to a stop from this velocity? (c) How far will it travel in each case?
Read more -
Chapter 2: Problem 30 College Physics 1
Consider the velocity vs. time graph of a person in an elevator shown in Figure \(2.58\). Suppose the elevator is initially at rest. It then accelerates for \(3\) seconds, maintains that velocity for \(15\) seconds, then decelerates for \(5\) seconds until it stops. The acceleration for the entire trip is not constant so we cannot use the equations of motion from Motion Equations for Constant Acceleration in One Dimension for the complete trip. (We could, however, use them in the three individual sections where acceleration is a constant.) Sketch graphs of (a) position vs. time and (b) acceleration vs. time for this trip. Equation Transcription: Text Transcription: 2.58 3 15 5
Read more -
Chapter 2: Problem 30 College Physics 1
Problem 30PE A fireworks shell is accelerated from rest to a velocity of 65.0 m/s over a distance of 0.250 m. (a) How long did the acceleration last? (b) Calculate the acceleration.
Read more -
Chapter 2: Problem 31 College Physics 1
Problem 31CQ A cylinder is given a push and then rolls up an inclined plane. If the origin is the starting point, sketch the position, velocity, and acceleration of the cylinder vs. time as it goes up and then down the plane.
Read more -
Chapter 2: Problem 31 College Physics 1
Problem 31PE A swan on a lake gets airborne by flapping its wings and running on top of the water. (a) If the swan must reach a velocity of 6.00 m/s to take off and it accelerates from rest at an average rate of 0.350 m/s2 , how far will it travel before becoming airborne? (b) How long does this take?
Read more -
Chapter 2: Problem 32 College Physics 1
Problem 32PE Professional Application: A woodpecker’s brain is specially protected from large decelerations by tendon-like attachments inside the skull. While pecking on a tree, the woodpecker’s head comes to a stop from an initial velocity of 0.600 m/s in a distance of only 2.00 mm. (a) Find the acceleration in m/s2 and in multiples of g(g = 9.80 m/s2). (b) Calculate the stopping time. (c) The tendons cradling the brain stretch, making its stopping distance 4.50 mm (greater than the head and, hence, less deceleration of the brain). What is the brain’s deceleration, expressed in multiples of g ?
Read more -
Chapter 2: Problem 33 College Physics 1
Problem 33PE An unwary football player collides with a padded goalpost while running at a velocity of 7.50 m/s and comes to a full stop after compressing the padding and his body 0.350 m. (a) What is his deceleration? (b) How long does the collision last?
Read more -
Chapter 2: Problem 37 College Physics 1
Problem 37PE Dragsters can actually reach a top speed of 145 m/s in only 4.45 s—considerably less time than given in Example 2.10 and Example 2.11. (a) Calculate the average acceleration for such a dragster. (b) Find the final velocity of this dragster starting from rest and accelerating at the rate found in (a) for 402 m (a quarter mile) without using any information on time. (c) Why is the final velocity greater than that used to find the average acceleration? Hint: Consider whether the assumption of constant acceleration is valid for a dragster. If not, discuss whether the acceleration would be greater at the beginning or end of the run and what effect that would have on the final velocity. Example 2.10: Calculating Displacement of an Accelerating Object: Dragsters Dragsters can achieve average accelerations of 26.0 m/s2 . Suppose such a dragster accelerates from rest at this rate for 5.56 s. How far does it travel in this time? Example 2.11: Calculating Final Velocity: Dragsters Calculate the final velocity of the dragster in Example 2.10 without using information about time.
Read more -
Chapter 2: Problem 38 College Physics 1
Problem 38PE A bicycle racer sprints at the end of a race to clinch a victory. The racer has an initial velocity of 11.5 m/s and accelerates at the rate of 0.500 m/s2 for 7.00 s. (a) What is his final velocity? (b) The racer continues at this velocity to the finish line. If he was 300 m from the finish line when he started to accelerate, how much time did he save? (c) One other racer was 5.00 m ahead when the winner started to accelerate, but he was unable to accelerate, and traveled at 11.8 m/s until the finish line. How far ahead of him (in meters and in seconds) did the winner finish?
Read more -
Chapter 2: Problem 39 College Physics 1
Problem 39PE In 1967, New Zealander Burt Munro set the world record for an Indian motorcycle, on the Bonneville Salt Flats in Utah, with a maximum speed of 183.58 mi/h. The one-way course was 5.00 mi long. Acceleration rates are often described by the time it takes to reach 60.0 mi/h from rest. If this time was 4.00 s, and Burt accelerated at this rate until he reached his maximum speed, how long did it take Burt to complete the course?
Read more -
Chapter 2: Problem 34 College Physics 1
Problem 34PE In World War II, there were several reported cases of airmen who jumped from their flaming airplanes with no parachute to escape certain death. Some fell about 20,000 feet (6000 m), and some of them survived, with few lifethreatening injuries. For these lucky pilots, the tree branches and snow drifts on the ground allowed their deceleration to be relatively small. If we assume that a pilot’s speed upon impact was 123 mph (54 m/s), then what was his deceleration? Assume that the trees and snow stopped him over a distance of 3.0 m.
Read more -
Chapter 2: Problem 35 College Physics 1
Problem 35PE Consider a grey squirrel falling out of a tree to the ground. (a) If we ignore air resistance in this case (only for the sake of this problem), determine a squirrel’s velocity just before hitting the ground, assuming it fell from a height of 3.0 m. (b) If the squirrel stops in a distance of 2.0 cm through bending its limbs, compare its deceleration with that of the airman in the previous problem. In World War II, there were several reported cases of airmen who jumped from their flaming airplanes with no parachute to escape certain death. Some fell about 20,000 feet (6000 m), and some of them survived, with few life threatening injuries. For these lucky pilots, the tree branches and snow drifts on the ground allowed their deceleration to be relatively small. If we assume that a pilot’s speed upon impact was 123 mph (54 m/s), then what was his deceleration? Assume that the trees and snow stopped him over a distance of 3.0 m.
Read more -
Chapter 2: Problem 36 College Physics 1
Problem 36PE An express train passes through a station. It enters with an initial velocity of 22.0 m/s and decelerates at a rate of 0.150 m/s2 as it goes through. The station is 210 m long. (a) How long is the nose of the train in the station? (b) How fast is it going when the nose leaves the station? (c) If the train is 130 m long, when does the end of the train leave the station? (d) What is the velocity of the end of the train as it leaves?
Read more -
Chapter 2: Problem 40 College Physics 1
Problem 40PE (a) A world record was set for the men’s 100-m dash in the 2008 Olympic Games in Beijing by Usain Bolt of Jamaica. Bolt “coasted” across the finish line with a time of 9.69 s. If we assume that Bolt accelerated for 3.00 s to reach his maximum speed, and maintained that speed for the rest of the race, calculate his maximum speed and his acceleration. (b) During the same Olympics, Bolt also set the world record in the 200-m dash with a time of 19.30 s. Using the same assumptions as for the 100-m dash, what was his maximum speed for this race?
Read more -
Chapter 2: Problem 41 College Physics 1
Problem 41PE Calculate the displacement and velocity at times of (a) 0.500, (b) 1.00, (c) 1.50, and (d) 2.00 s for a ball thrown straight up with an initial velocity of 15.0 m/s. Take the point of release to be y0 = 0 .
Read more -
Chapter 2: Problem 42 College Physics 1
Problem 42PE Calculate the displacement and velocity at times of (a) 0.500, (b) 1.00, (c) 1.50, (d) 2.00, and (e) 2.50 s for a rock thrown straight down with an initial velocity of 14.0 m/s from the Verrazano Narrows Bridge in New York City. The roadway of this bridge is 70.0 m above the water.
Read more -
Chapter 2: Problem 44 College Physics 1
Problem 44PE A rescue helicopter is hovering over a person whose boat has sunk. One of the rescuers throws a life preserver straight down to the victim with an initial velocity of 1.40 m/s and observes that it takes 1.8 s to reach the water. (a) List the knowns in this problem. (b) How high above the water was the preserver released? Note that the downdraft of the helicopter reduces the effects of air resistance on the falling life preserver, so that an acceleration equal to that of gravity is reasonable.
Read more -
Chapter 2: Problem 45 College Physics 1
A dolphin in an aquatic show jumps straight up out of the water at a velocity of 13.0 m/s. (a) List the knowns in this problem. (b) How high does his body rise above the water? To solve this part, first note that the final velocity is now a known and identify its value. Then identify the unknown, and discuss how you chose the appropriate equation to solve for it. After choosing the equation, show your steps in solving for the unknown, checking units, and discuss whether the answer is reasonable. (c) How long is the dolphin in the air? Neglect any effects due to his size or orientation.
Read more -
Chapter 2: Problem 43 College Physics 1
Problem 43PE A basketball referee tosses the ball straight up for the starting tip-off. At what velocity must a basketball player leave the ground to rise 1.25 m above the floor in an attempt to get the ball?
Read more -
Chapter 2: Problem 46 College Physics 1
A swimmer bounces straight up from a diving board and falls feet first into a pool. She starts with a velocity of 4.00 m/s, and her takeoff point is 1.80 m above the pool. (a) How long are her feet in the air? (b) What is her highest point above the board? (c) What is her velocity when her feet hit the water?
Read more -
Chapter 2: Problem 47 College Physics 1
(a) Calculate the height of a cliff if it takes 2.35 s for a rock to hit the ground when it is thrown straight up from the cliff with an initial velocity of 8.00 m/s. (b) How long would it take to reach the ground if it is thrown straight down with the same speed?
Read more -
Chapter 2: Problem 48 College Physics 1
Problem 48PE A very strong, but inept, shot putter puts the shot straight up vertically with an initial velocity of 11.0 m/s. How long does he have to get out of the way if the shot was released at a height of 2.20 m, and he is 1.80 m tall?
Read more -
Chapter 2: Problem 49 College Physics 1
Problem 49PE You throw a ball straight up with an initial velocity of 15.0 m/s. It passes a tree branch on the way up at a height of 7.00 m. How much additional time will pass before the ball passes the tree branch on the way back down?
Read more -
Chapter 2: Problem 51 College Physics 1
Problem 51PE Standing at the base of one of the cliffs of Mt. Arapiles in Victoria, Australia, a hiker hears a rock break loose from a height of 105 m. He can’t see the rock right away but then does, 1.50 s later. (a) How far above the hiker is the rock when he can see it? (b) How much time does he have to move before the rock hits his head?
Read more -
Chapter 2: Problem 52 College Physics 1
Problem 52PE An object is dropped from a height of 75.0 m above ground level. (a) Determine the distance traveled during the first second. (b) Determine the final velocity at which the object hits the ground. (c) Determine the distance traveled during the last second of motion before hitting the ground.
Read more -
Chapter 2: Problem 53 College Physics 1
Problem 53PE There is a 250-m-high cliff at Half Dome in Yosemite National Park in California. Suppose a boulder breaks loose from the top of this cliff. (a) How fast will it be going when it strikes the ground? (b) Assuming a reaction time of 0.300 s, how long will a tourist at the bottom have to get out of the way after hearing the sound of the rock breaking loose (neglecting the height of the tourist, which would become negligible anyway if hit)? The speed of sound is 335 m/s on this day.
Read more -
Chapter 2: Problem 54 College Physics 1
Problem 55PE Suppose you drop a rock into a dark well and, using precision equipment, you measure the time for the sound of a splash to return. (a) Neglecting the time required for sound to travel up the well, calculate the distance to the water if the sound returns in 2.0000 s. (b) Now calculate the distance taking into account the time for sound to travel up the well. The speed of sound is 332.00 m/s in this well.
Read more -
Chapter 2: Problem 55 College Physics 1
Problem 55PE Suppose you drop a rock into a dark well and, using precision equipment, you measure the time for the sound of a splash to return. (a) Neglecting the time required for sound to travel up the well, calculate the distance to the water if the sound returns in 2.0000 s. (b) Now calculate the distance taking into account the time for sound to travel up the well. The speed of sound is 332.00 m/s in this well.
Read more -
Chapter 2: Problem 56 College Physics 1
Problem 56PE A steel ball is dropped onto a hard floor from a height of 1.50 m and rebounds to a height of 1.45 m. (a) Calculate its velocity just before it strikes the floor. (b) Calculate its velocity just after it leaves the floor on its way back up. (c) Calculate its acceleration during contact with the floor if that contact lasts 0.0800 ms (8.00×10?5 s) . (d) How much did the ball compress during its collision with the floor, assuming the floor is absolutely rigid?
Read more -
Chapter 2: Problem 57 College Physics 1
Problem 57PE A coin is dropped from a hot-air balloon that is 300 m above the ground and rising at 10.0 m/s upward. For the coin, find (a) the maximum height reached, (b) its position and velocity 4.00 s after being released, and (c) the time before it hits the ground.
Read more -
Chapter 2: Problem 58 College Physics 1
Problem 58PE A coin is dropped from a hot-air balloon that is 300 m above the ground and rising at 10.0 m/s upward. For the coin, find (a) the maximum height reached, (b) its position and velocity 4.00 s after being released, and (c) the time before it hits the ground.
Read more -
Chapter 2: Problem 59 College Physics 1
(a) By taking the slope of the curve in Figure \(2.60\), verify that the velocity of the jet car is \(115 \mathrm{~m} / \mathrm{s}\) at \(t=20 \mathrm{~s}\). (b) By taking the slope of the curve at any point in Figure \(2.61\), verify that the jet car's acceleration is \(5.0 \mathrm{~m} / \mathrm{s}^{2}\). Equation Transcription: Text Transcription: 2.60 115 m/s t=20 s 2.61 5.0 m/s^2
Read more -
Chapter 2: Problem 60 College Physics 1
Using approximate values, calculate the slope of the curve in Figure \(2.62\) to verify that the velocity at \(t=10.0 \mathrm{~s}\) is \(0.208 \mathrm{~m} / \mathrm{s}\). Assume all values are known to \(3\) significant figures. Equation Transcription: Text Transcription: 2.62 t=10.0 s 0.208 m/s 3
Read more -
Chapter 2: Problem 61 College Physics 1
Using approximate values, calculate the slope of the curve in Figure \(2.62\) to verify that the velocity at \(t=30.0 \mathrm{~s}\) is \(0.238 \mathrm{~m} / \mathrm{s}\). Assume all values are known to \(3\) significant figures. Equation Transcription: Text Transcription: 2.62 t=30.0 s 0.238 m/s 3
Read more -
Chapter 2: Problem 62 College Physics 1
By taking the slope of the curve in Figure \(2.63\), verify that the acceleration is \(3.2 \mathrm{~m} / \mathrm{s}^{2}\) at \(t=10 \mathrm{~s}\). Equation Transcription: Text Transcription: 2.63 3.2 m/s^2 t=10 s
Read more -
Chapter 2: Problem 63 College Physics 1
Construct the displacement graph for the subway shuttle train as shown in Figure \(2.18\) (a). Your graph should show the position of the train, in kilometers, from \(t = 0\) to \(20 s\). You will need to use the information on acceleration and velocity given in the examples for this figure. Equation Transcription: Text Transcription: 2.18 t=0 20 s
Read more -
Chapter 2: Problem 64 College Physics 1
(a) Take the slope of the curve in Figure \(2.64\) to find the jogger’s velocity at \(t = 2.5 s\) . (b) Repeat at \(7.5 s\). These values must be consistent with the graph in Figure \(2.65\). Equation Transcription: Text Transcription: 2.64 t=2.5 s 7.5 s 2.65
Read more -
Chapter 2: Problem 65 College Physics 1
A graph of \(v(t)\) is shown for a world-class track sprinter in a \(100-m\) race. (See Figure \(2.67\)). (a) What is his average velocity for the first \(4 s\)? (b) What is his instantaneous velocity at \(t = 5 s\) ? (c) What is his average acceleration between \(0\) and \(4 s\)? (d) What is his time for the race? Equation Transcription: Text Transcription: v(t) 100-m 2.67 4s t=5 s 0 4 s
Read more