Solution Found!
The two scatterplots below show the relationship between
Chapter , Problem 7.5(choose chapter or problem)
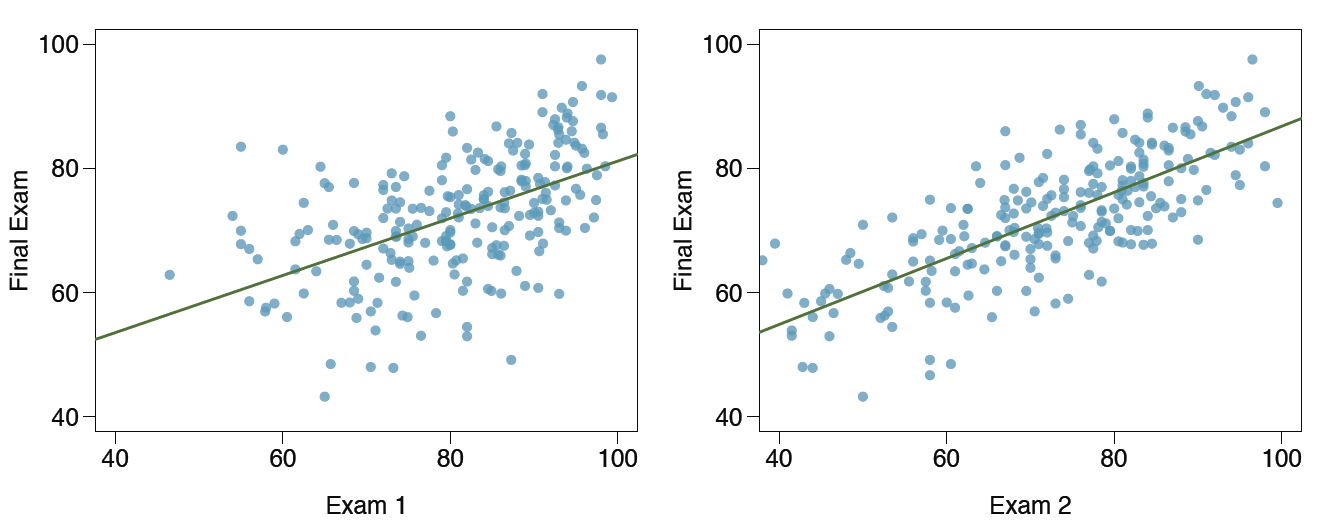
The two scatterplots below show the relationship between final and mid-semester exam grades recorded during several years for a Statistics course at a university.
(a) Based on these graphs, which of the two exams has the strongest correlation with the final exam grade? Explain.
(b) Can you think of a reason why the correlation between the exam you chose in part (a) and the final exam is higher?
Questions & Answers
QUESTION:
The two scatterplots below show the relationship between final and mid-semester exam grades recorded during several years for a Statistics course at a university.
(a) Based on these graphs, which of the two exams has the strongest correlation with the final exam grade? Explain.
(b) Can you think of a reason why the correlation between the exam you chose in part (a) and the final exam is higher?
ANSWER:
Step 1 of 4
The scatterplots show the relationship between final and mid-semester exam grades recorded during several years for a Statistics course at a university. Using these plots we can determine the following: