Solution Found!
The cycle represented in Figure 19-12 (next to 19-14) is
Chapter , Problem 72(choose chapter or problem)
QUESTION:
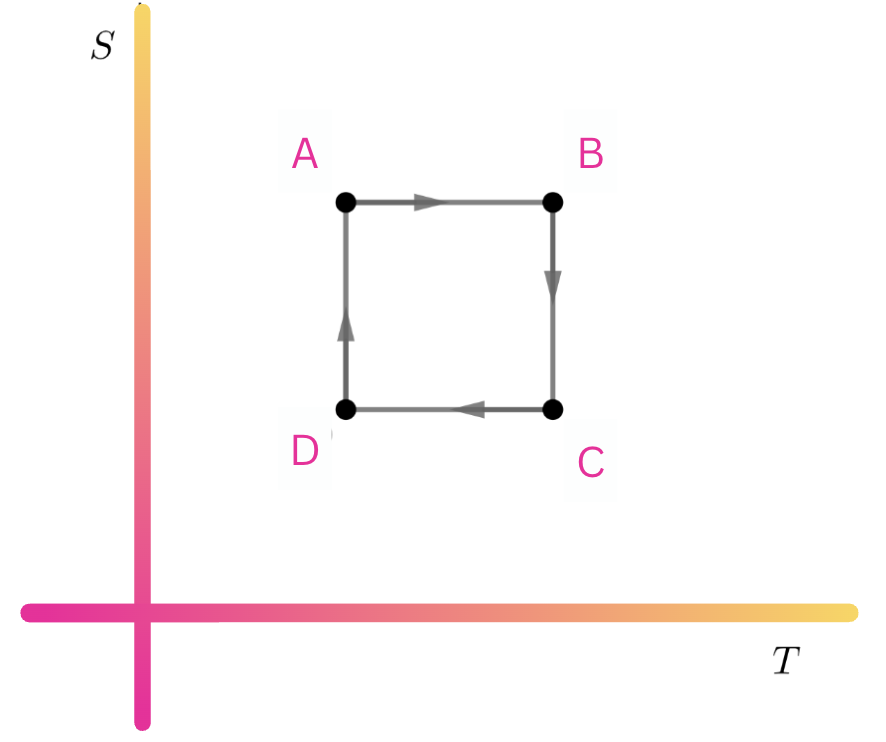
The cycle represented in Figure 19-12 (next to 19-14) is for 1.00 mol of an ideal monatomic gas. The temperatures at points A and B are 300 and 750 K, respectively. What is the efficiency of the cyclic process ABCDA?
Questions & Answers
QUESTION:
The cycle represented in Figure 19-12 (next to 19-14) is for 1.00 mol of an ideal monatomic gas. The temperatures at points A and B are 300 and 750 K, respectively. What is the efficiency of the cyclic process ABCDA?
ANSWER:Step 1 of 3
We have given


Consider the figure 19-12 as represented below