Solution Found!
Chemical plant contamination. Refer to Exercise 12.18(p.
Chapter 12, Problem 28E(choose chapter or problem)
Chemical plant contamination. Refer to Exercise 12.18 (p. 683) and the U.S. Army Corps of Engineers study. You fit the first-order model, \(E(y)=\beta_0+\beta_1 x_1+\beta_2 x_2+\beta_3 x_3\),
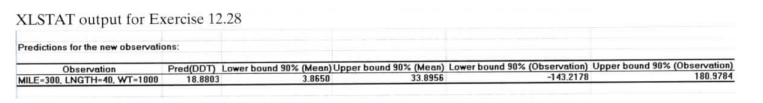
to the data, where y = DDT level (parts per million), \(x_1=\) number of miles upstream, \(x_2=\) length (centimeters), and \(x_3=\) weight (grams). Use the Excel/XLSTAT printout above to predict, with 90% confidence, the DDT level of a fish caught 300 miles upstream with a length of 40 centimeters and a weight of 1,000 grams. Interpret the result.
Questions & Answers
QUESTION:
Chemical plant contamination. Refer to Exercise 12.18 (p. 683) and the U.S. Army Corps of Engineers study. You fit the first-order model, \(E(y)=\beta_0+\beta_1 x_1+\beta_2 x_2+\beta_3 x_3\),
to the data, where y = DDT level (parts per million), \(x_1=\) number of miles upstream, \(x_2=\) length (centimeters), and \(x_3=\) weight (grams). Use the Excel/XLSTAT printout above to predict, with 90% confidence, the DDT level of a fish caught 300 miles upstream with a length of 40 centimeters and a weight of 1,000 grams. Interpret the result.
ANSWER:Step 1 of 2
From the SPSS output, the 90% prediction interval for the DDT level is –143.2178 and 180.9784.
That is, the estimated DDT level 18.8803 of a fish caught 300 miles upstream with a length of 40 centimeters and a weight of 1,000 grams will lie between –143.2178 and 180.9784.