Solution Found!
Suppose the true relationship between E(y) and the
Chapter 12, Problem 35E(choose chapter or problem)
Problem 35E
Suppose the true relationship between E(y) and the quantitative independent variables x1 and x2 is
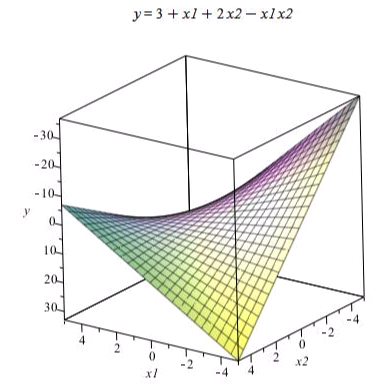
E(y) = 3 + x1 + 2x2 - x1x2
a. Describe the corresponding three-dimensional responsesurface.
b. Plot the linear relationship between y and x2 forx1 = 0, 1, 2, where 0 ≤ x2 ≤ 5.
c. Explain why the lines you plotted in part b are notparallel.
d. Use the lines you plotted in part b to explain howchanges in the settings of x1 and x2 affect E(y).
e. Use your graph from part b to determine how muchE(y) changes when x1 is changed from 2 to 0 and x2 issimultaneously changed from 4 to 5.
Questions & Answers
QUESTION:
Problem 35E
Suppose the true relationship between E(y) and the quantitative independent variables x1 and x2 is
E(y) = 3 + x1 + 2x2 - x1x2
a. Describe the corresponding three-dimensional responsesurface.
b. Plot the linear relationship between y and x2 forx1 = 0, 1, 2, where 0 ≤ x2 ≤ 5.
c. Explain why the lines you plotted in part b are notparallel.
d. Use the lines you plotted in part b to explain howchanges in the settings of x1 and x2 affect E(y).
e. Use your graph from part b to determine how muchE(y) changes when x1 is changed from 2 to 0 and x2 issimultaneously changed from 4 to 5.
ANSWER:
Step 1 of 6
For the given information, the true relationship between E (y) and the quantitative
independent variables 


a) We have to draw the three dimensional response surfaces.
By using Maple we get the plot as follows: