Solution Found!
Chunky data. BPI Consulting, a leading provider of
Chapter 13, Problem 21E(choose chapter or problem)
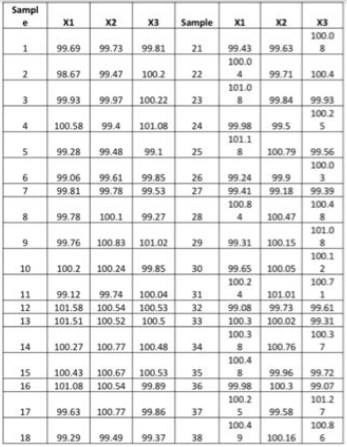
Chunky data. BFI Consulting, a leading provider of statistical process control software and training in the United States, recently alerted its clients to problems with “chunky” data. In an April 2007 report, BPI Consulting identifies “chunky” data as data that results when the range between possible values of the variable of interest becomes too large. This typically occurs when the data are rounded. For example, a company monitor lug the time it takes shipments to arrive from a given supplier rounded off the data to the nearest day. To show the effect of chunky data on a control chart, BP1 Consulting considered a process with a quality characteristic that averages about 100. Data on the quality characteristic for a random sample of 3 observations collected each hour for 40 consecutive hours are given in the table above. (The data are saved in the CHUNKY file.) (Note: BPl Consulting cautions its clients that out-of- control data points in this example were actually due to the measurement process and not to an “out-of-control” process.)
a. Show that the process is “in control,” according to Rule 1, by constructing an -chart for the data.

b. Round each measurement in the data set to a whole number and then form an -chart for the rounded data. What do you observe?

Questions & Answers
QUESTION:
Chunky data. BFI Consulting, a leading provider of statistical process control software and training in the United States, recently alerted its clients to problems with “chunky” data. In an April 2007 report, BPI Consulting identifies “chunky” data as data that results when the range between possible values of the variable of interest becomes too large. This typically occurs when the data are rounded. For example, a company monitor lug the time it takes shipments to arrive from a given supplier rounded off the data to the nearest day. To show the effect of chunky data on a control chart, BP1 Consulting considered a process with a quality characteristic that averages about 100. Data on the quality characteristic for a random sample of 3 observations collected each hour for 40 consecutive hours are given in the table above. (The data are saved in the CHUNKY file.) (Note: BPl Consulting cautions its clients that out-of- control data points in this example were actually due to the measurement process and not to an “out-of-control” process.)
a. Show that the process is “in control,” according to Rule 1, by constructing an -chart for the data.
b. Round each measurement in the data set to a whole number and then form an -chart for the rounded data. What do you observe?
ANSWER:
Step 1 of 22
(a)
Construct a 
The table below shows the calculation of 

Sample |
X1 |
X2 |
X3 |
Minimum |
Maximum |
Range |
|
1 |
99.69 |
99.73 |
99.81 |
99.743 |
99.69 |
99.81 |
0.12 |
2 |
98.67 |
99.47 |
100.2 |
99.447 |
98.67 |
100.2 |
1.53 |
3 |
99.93 |
99.97 |
100.22 |
100.04 |
99.93 |
100.22 |
0.29 |
4 |
100.58 |
99.4 |
101.08 |
100.353 |
99.4 |
101.08 |
1.68 |
5 |
99.28 |
99.48 |
99.1 |
99.287 |
99.1 |
99.48 |
0.38 |
6 |
99.06 |
99.61 |
99.85 |
99.507 |
99.06 |
99.85 |
0.79 |
7 |
99.81 |
99.78 |
99.53 |
99.707 |
99.53 |
99.81 |
0.28 |
8 |
99.78 |
100.1 |
99.27 |
99.717 |
99.27 |
100.1 |
0.83 |
9 |
99.76 |
100.83 |
101.02 |
100.537 |
99.76 |
101.02 |
1.26 |
10 |
100.2 |
100.24 |
99.85 |
100.097 |
99.85 |
100.24 |
0.39 |
11 |
99.12 |
99.74 |
100.04 |
99.633 |
99.12 |
100.04 |
0.92 |
12 |
101.58 |
100.54 |
100.53 |
100.883 |
100.53 |
101.58 |
1.05 |
13 |
101.51 |
100.52 |
100.5 |
100.843 |
100.5 |
101.51 |
1.01 |
14 |
100.27 |
100.77 |
100.48 |
100.507 |
100.27 |
100.77 |
0.5 |
15 |
100.43 |
100.67 |
100.53 |
100.543 |
100.43 |
100.67 |
0.24 |
16 |
101.08 |
100.54 |
99.89 |
100.503 |
99.89 |
101.08 |
1.19 |
17 |
99.63 |
100.77 |
99.86 |
100.087 |
99.63 |
100.77 |
1.14 |
18 |
99.29 |
99.49 |
99.37 |
99.383 |
99.29 |
99.49 |
0.2 |
19 |
99.89 |
100.75 |
100.73 |
100.457 |
99.89 |
100.75 |
0.86 |
20 |
100.54 |
101.51 |
100.54 |
100.863 |
100.54 |
101.51 |
0.97 |
21 |
99.43 |
99.63 |
100.08 |
99.713 |
99.43 |
100.08 |
0.65 |
22 |
100.04 |
99.71 |
100.4 |
100.05 |
99.71 |
100.4 |
0.69 |
23 |
101.08 |
99.84 |
99.93 |
100.283 |
99.84 |
101.08 |
1.24 |
24 |
99.98 |
99.5 |
100.25 |
99.91 |
99.5 |
100.25 |
0.75 |
25 |
101.18 |
100.79 |
99.56 |
100.51 |
99.56 |
101.18 |
1.62 |
26 |
99.24 |
99.9 |
100.03 |
99.723 |
99.24 |
100.03 |
0.79 |
27 |
99.41 |
99.18 |
99.39 |
99.327 |
99.18 |
99.41 |
0.23 |
28 |
100.84 |
100.47 |
100.48 |
100.597 |
100.47 |
100.84 |
0.37 |
29 |
99.31 |
100.15 |
101.08 |
100.18 |
99.31 |
101.08 |
1.77 |
30 |
99.65 |
100.05 |
100.12 |
99.94 |
99.65 |
100.12 |
0.47 |
31 |
100.24 |
101.01 |
100.71 |
100.653 |
100.24 |
101.01 |
0.77 |
32 |
99.08 |
99.73 |
99.61 |
99.473 |
99.08 |
99.73 |
0.65 |
33 |
100.3 |
100.02 |
99.31 |
99.877 |
99.31 |
100.3 |
0.99 |
34 |
100.38 |
100.76 |
100.37 |
100.503 |
100.37 |
100.76 |
0.39 |
35 |
100.48 |
99.96 |
99.72 |
100.053 |
99.72 |
100.48 |
0.76 |
36 |
99.98 |
100.3 |
99.07 |
99.783 |
99.07 |
100.3 |
1.23 |
37 |
100.25 |
99.58 |
101.27 |
100.367 |
99.58 |
101.27 |
1.69 |
38 |
100.49 |
100.16 |
100.86 |
100.503 |
100.16 |
100.86 |
0.7 |
39 |
100.44 |
100.53 |
99.84 |
100.27 |
99.84 |
100.53 |
0.69 |
40 |
99.45 |
99.41 |
99.27 |
99.377 |
99.27 |
99.45 |
0.18 |


Table (1)