Solution Found!
Solved: Construct and interpret an R-chart and an from the
Chapter 13, Problem 28E(choose chapter or problem)
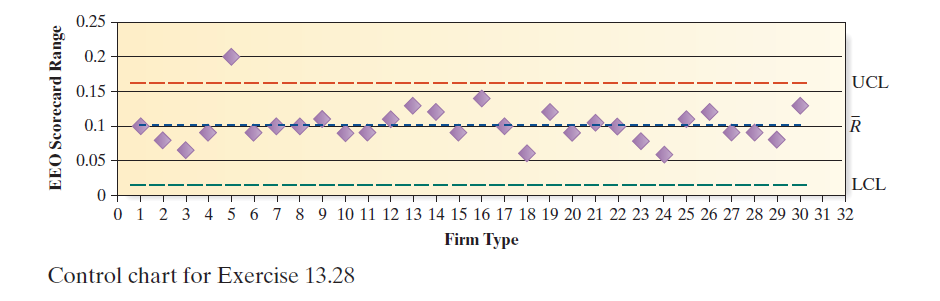
Detecting gender-related employment disparities. Refer to the Federal Reserve Bank of Atlanta, Working Paper Series (October 2008) study of gender-related employment disparities. Recall that the researchers used the Equal Employment Opportunity (EEOC) Systematic Gender Disparity Scorecard as a measure of the degree to which a firm complies with EEOC guidelines for eliminating gender bias. An R-chart for the data obtained by sampling firms for each of 30 different service industry firm types is shown above. The centerline and upper and lower control limits are shown on the chart.
a. What are the approximate values of \(\bar{R}\), UCL, and LCL?
b. What conclusions can you draw from the chart? Are there any firm types that should concern the EEOC? Why?
Questions & Answers
QUESTION:
Detecting gender-related employment disparities. Refer to the Federal Reserve Bank of Atlanta, Working Paper Series (October 2008) study of gender-related employment disparities. Recall that the researchers used the Equal Employment Opportunity (EEOC) Systematic Gender Disparity Scorecard as a measure of the degree to which a firm complies with EEOC guidelines for eliminating gender bias. An R-chart for the data obtained by sampling firms for each of 30 different service industry firm types is shown above. The centerline and upper and lower control limits are shown on the chart.
a. What are the approximate values of \(\bar{R}\), UCL, and LCL?
b. What conclusions can you draw from the chart? Are there any firm types that should concern the EEOC? Why?
ANSWER:
Step 1 of 3
The given data is

For the given data the R-chart is constructed by using software is shown below

From the above R-chart
The center line is 4.03
Upper control limit is 7.755, and
Lower control limit is 0.305