Solution Found!
In Exercises 37 40, without performing any calculations, determine which measureof
Chapter 2, Problem 40(choose chapter or problem)
QUESTION:
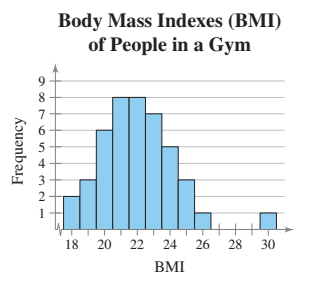
Without performing any calculations, determine which measure of central tendency best represents the graphed data. Explain your reasoning.Body Mass Indexes (BMI) of People in a Gym
Questions & Answers
QUESTION:
Without performing any calculations, determine which measure of central tendency best represents the graphed data. Explain your reasoning.Body Mass Indexes (BMI) of People in a Gym
Step 1 of 2
The distribution of body mass indexes (BML) of people in a gym has an outlier in a class with midpoint 30.