Solution Found!
During the course of an internship at a company that manufactures diesel engine fuel
Chapter 6, Problem 6.1-3(choose chapter or problem)
During the course of an internship at a company that manufactures diesel engine fuel injector pumps, a student had to measure the category plungers that force the fuel out of the pumps. This category is based on a relative scale, measuring the difference in diameter (in microns or micrometers) of a plunger from that of an absolute minimum acceptable diameter. For 96 plungers randomly taken from the production line, the data are as follows: 17.1 19.3 18.0 19.4 16.5 14.4 15.8 16.6 18.5 14.9 14.8 16.3 20.8 17.8 14.8 15.6 16.7 16.1 17.1 16.5 18.8 19.3 18.1 16.1 18.0 17.2 16.8 17.3 14.4 14.1 16.9 17.6 15.5 17.8 17.2 17.4 18.1 18.4 17.8 16.7 17.2 13.7 18.0 15.6 17.8 17.0 17.7 11.9 15.9 17.8 15.5 14.6 15.6 15.1 15.4 16.1 16.6 17.1 19.1 15.0 17.6 19.7 17.1 13.6 15.6 16.3 14.8 17.4 14.8 14.9 14.1 17.8 19.8 18.9 15.6 16.1 15.9 15.7 22.1 16.1 18.9 21.5 17.4 12.3 20.2 14.9 17.1 15.0 14.4 14.7 15.9 19.0 16.6 15.3 17.7 15.8 (a) Calculate the sample mean and the sample standard deviation of these measurements. (b) Use the class boundaries 10.95, 11.95, ... , 22.95 to construct a histogram of the data.
Questions & Answers
QUESTION:
During the course of an internship at a company that manufactures diesel engine fuel injector pumps, a student had to measure the category plungers that force the fuel out of the pumps. This category is based on a relative scale, measuring the difference in diameter (in microns or micrometers) of a plunger from that of an absolute minimum acceptable diameter. For 96 plungers randomly taken from the production line, the data are as follows: 17.1 19.3 18.0 19.4 16.5 14.4 15.8 16.6 18.5 14.9 14.8 16.3 20.8 17.8 14.8 15.6 16.7 16.1 17.1 16.5 18.8 19.3 18.1 16.1 18.0 17.2 16.8 17.3 14.4 14.1 16.9 17.6 15.5 17.8 17.2 17.4 18.1 18.4 17.8 16.7 17.2 13.7 18.0 15.6 17.8 17.0 17.7 11.9 15.9 17.8 15.5 14.6 15.6 15.1 15.4 16.1 16.6 17.1 19.1 15.0 17.6 19.7 17.1 13.6 15.6 16.3 14.8 17.4 14.8 14.9 14.1 17.8 19.8 18.9 15.6 16.1 15.9 15.7 22.1 16.1 18.9 21.5 17.4 12.3 20.2 14.9 17.1 15.0 14.4 14.7 15.9 19.0 16.6 15.3 17.7 15.8 (a) Calculate the sample mean and the sample standard deviation of these measurements. (b) Use the class boundaries 10.95, 11.95, ... , 22.95 to construct a histogram of the data.
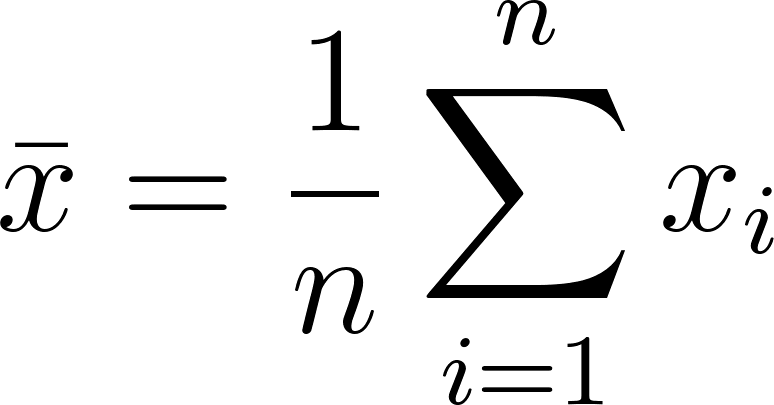
ANSWER:Step 1 of 3
Sample mean is given by

Sample variance is given by


Sample standard deviation is given by

