Solution Found!
Ledolter and Hogg (see References) report 64 observations that are a sample of daily
Chapter 6, Problem 6.1-7(choose chapter or problem)
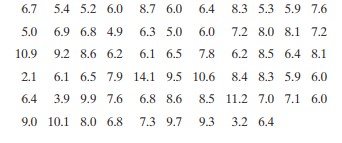
Ledolter and Hogg (see References) report 64 observations that are a sample of daily weekday afternoon (3 to 7 p.m.) lead concentrations (in micrograms per cubic meter, \(\mu \mathrm{g} / \mathrm{m}^{3}\)). The following data were recorded at an air-monitoring station near the San Diego Freeway in Los Angeles during the fall of 1976:
\(\begin{array}{rrrrrrrrrrr}
6.7 & 5.4 & 5.2 & 6.0 & 8.7 & 6.0 & 6.4 & 8.3 & 5.3 & 5.9 & 7.6 \\
5.0 & 6.9 & 6.8 & 4.9 & 6.3 & 5.0 & 6.0 & 7.2 & 8.0 & 8.1 & 7.2 \\
10.9 & 9.2 & 8.6 & 6.2 & 6.1 & 6.5 & 7.8 & 6.2 & 8.5 & 6.4 & 8.1 \\
2.1 & 6.1 & 6.5 & 7.9 & 14.1 & 9.5 & 10.6 & 8.4 & 8.3 & 5.9 & 6.0 \\
6.4 & 3.9 & 9.9 & 7.6 & 6.8 & 8.6 & 8.5 & 11.2 & 7.0 & 7.1 & 6.0 \\
9.0 & 10.1 & 8.0 & 6.8 & 7.3 & 9.7 & 9.3 & 3.2 & 6.4 & &
\end{array}\)
(a) Construct a frequency distribution of the data and display the results in the form of a histogram. Is this distribution symmetric?
(b) Calculate the sample mean and sample standard deviation.
(c) Locate \(\bar{x}\) and \(\bar{x} \pm s\) on your histogram. How many observations lie within one standard deviation of the mean? How many lie within two standard deviations of the mean?
Questions & Answers
QUESTION:
Ledolter and Hogg (see References) report 64 observations that are a sample of daily weekday afternoon (3 to 7 p.m.) lead concentrations (in micrograms per cubic meter, \(\mu \mathrm{g} / \mathrm{m}^{3}\)). The following data were recorded at an air-monitoring station near the San Diego Freeway in Los Angeles during the fall of 1976:
\(\begin{array}{rrrrrrrrrrr}
6.7 & 5.4 & 5.2 & 6.0 & 8.7 & 6.0 & 6.4 & 8.3 & 5.3 & 5.9 & 7.6 \\
5.0 & 6.9 & 6.8 & 4.9 & 6.3 & 5.0 & 6.0 & 7.2 & 8.0 & 8.1 & 7.2 \\
10.9 & 9.2 & 8.6 & 6.2 & 6.1 & 6.5 & 7.8 & 6.2 & 8.5 & 6.4 & 8.1 \\
2.1 & 6.1 & 6.5 & 7.9 & 14.1 & 9.5 & 10.6 & 8.4 & 8.3 & 5.9 & 6.0 \\
6.4 & 3.9 & 9.9 & 7.6 & 6.8 & 8.6 & 8.5 & 11.2 & 7.0 & 7.1 & 6.0 \\
9.0 & 10.1 & 8.0 & 6.8 & 7.3 & 9.7 & 9.3 & 3.2 & 6.4 & &
\end{array}\)
(a) Construct a frequency distribution of the data and display the results in the form of a histogram. Is this distribution symmetric?
(b) Calculate the sample mean and sample standard deviation.
(c) Locate \(\bar{x}\) and \(\bar{x} \pm s\) on your histogram. How many observations lie within one standard deviation of the mean? How many lie within two standard deviations of the mean?
ANSWER:Step 1 of 4
The data given is