Solution Found!
21 35 33 25 22 26 21 24 16 32 25 20 30 20 20 29 21 19 18 24 33 22 23 25 17 23 25 29 25
Chapter 3, Problem 11(choose chapter or problem)
QUESTION:
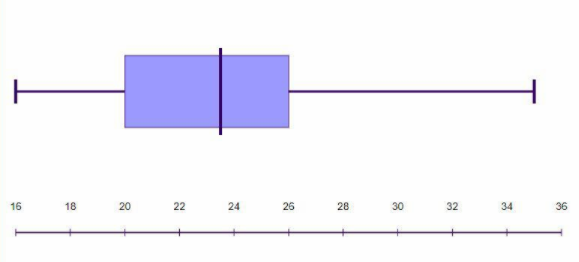
21 35 33 25 22 26 21 24 16 32 25 20 30 20 20 29 21 19 18 24 33 22 23 25 17 23 25 29 25 19 Source: General Social Survey (a) Construct a boxplot of the data. (b) Use the boxplot and quartiles to describe the shape of the distribution.
Questions & Answers
QUESTION:
21 35 33 25 22 26 21 24 16 32 25 20 30 20 20 29 21 19 18 24 33 22 23 25 17 23 25 29 25 19 Source: General Social Survey (a) Construct a boxplot of the data. (b) Use the boxplot and quartiles to describe the shape of the distribution.
ANSWER:Step 1 of 2
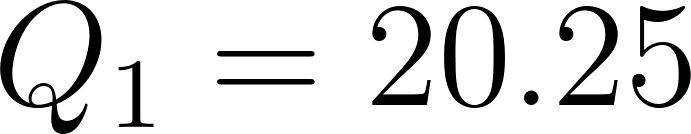
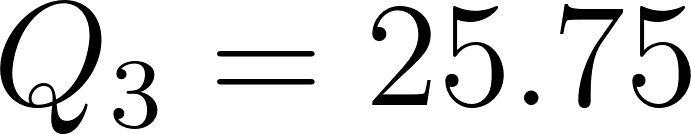
Five number summary
Minimum value is =16
Maximum value =35
Median 23.5