Solution Found!
Graphical Analysis The histograms shown below represent
Chapter 4, Problem 3E(choose chapter or problem)
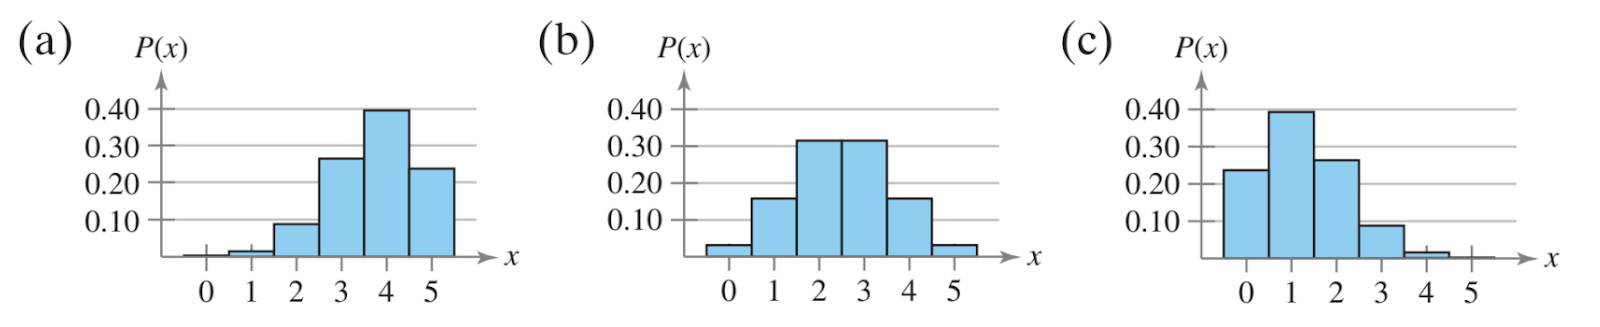
The histograms shown below represent binomial distributions with the same number of trials n but different probabilities of success p. Match each probability with the correct graph. Explain your reasoning.
\(p=0.25,p=0.50,p=0.75\)
Equation Transcription:
Text Transcription:
p=0.25,p=0.50,p=0.75
Questions & Answers
QUESTION:
The histograms shown below represent binomial distributions with the same number of trials n but different probabilities of success p. Match each probability with the correct graph. Explain your reasoning.
\(p=0.25,p=0.50,p=0.75\)
Equation Transcription:
Text Transcription:
p=0.25,p=0.50,p=0.75
ANSWER:
Solution:
Step 1 of 4:
Let X follows the Binomial distribution with probability mass function.
P(X = x) =
Mean is np and variance is npq.