Problem 28E Fuel economy Describe what these boxplots tell you about the relationship between the number of cylinders a car’s engine has and the car’s fuel economy (mpg):
Read moreTable of Contents
1
Stats Starts Here
2
Displaying and Describing Categorical Data
3
Displaying and Summarizing Quantitative Data
4
Understanding and Comparing Distributions
5
The Standard Deviation as a Ruler and the Normal Model
6
Scatterplots, Association, and Correlation
7
Linear Regression
8
Regression Wisdom
9
Re-expressing Data: Get It Straight!
10
Understanding Randomness
11
Sample Surveys
12
Experiments and Observational Studies
Textbook Solutions for Stats: Data and Models
Chapter 4 Problem 18E
Question
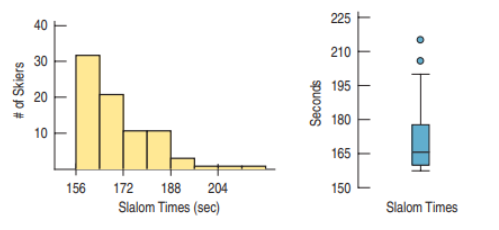
Slalom times 2010 The Men’s Giant Slalom skiing event consists of two runs whose times are added together for a final score. Two displays of the giant slalom times in the 2010 Winter Olympics are shown below.
a) What features of the distribution can you see in both the histogram and the boxplot?
b) What summary statistic would you choose to summarize the center of this distribution? Why?
c) What summary statistic would you choose to summarize the spread of this distribution? Why?
Solution
Step 1 of 3
(a)
One of the variables measured in the 2010 The Men’s Giant Slalom skiing event is Slalom times in second. And the other variable is the number of Skiers. We have given a histogram and 5-number summary of the event.
The distribution is unimodal and skewed to the right. The Median Slalom time is about 165 seconds. The minimum Slalom times is 156 and maximum of 215. We also see two possible outliers with Slalom times of 215 and 206 . Almost half of the number of skiers the Slalom time is between 160 and 178.
Subscribe to view the
full solution
full solution
Title
Stats: Data and Models 4
Author
Richard D. De Veaux, Paul F. Velleman, David E. Bock
ISBN
9780321986498
Slalom times 2010 The Men’s Giant Slalom skiing event
Chapter 4 textbook questions
-
Chapter 4: Problem 28 Stats: Data and Models 4
-
Chapter 4: Problem 26 Stats: Data and Models 4
Problem 26E Gas prices 2013 Here are boxplots of weekly gas prices for regular gas in the United States as reported by the U.S. Energy Information Administration for 2009 through 2013. a) Compare the distribution of prices over the five years. b) Compare the stability of prices over the five years.
Read more -
Chapter 4: Problem 27 Stats: Data and Models 4
Marriage age In 1975, did men and women marry at the same age? Here are boxplots of the age at first marriage for a sample of U.S. citizens then. Write a brief report discussing what these data show.
Read more -
Chapter 4: Problem 29 Stats: Data and Models 4
Problem 29E Fuel economy 2012 The Environmental Protection Agency provides fuel economy and pollution information on over 2000 car models. Here are boxplots of Combined Fuel Economy (using an average of driving conditions) in miles per gallon by vehicle Type (midsize car, standard pickup truck, or SUV) for 2012 model vehicles. Summarize what you see about the fuel economies of the three vehicle types.
Read more -
Chapter 4: Problem 30 Stats: Data and Models 4
Problem 30E Ozone Ozone levels (in parts per billion, ppb) were recorded at sites in New Jersey monthly between 1926 and 1971. Here are boxplots of the data for each month (over the 46 years), lined up in order (January = 1): a) In what month was the highest ozone level ever recorded? ________________ b) Which month has the largest IQR? ________________ c) Which month has the smallest range? ________________ d) Write a brief comparison of the ozone levels in January and June. ________________ e) Write a report on the annual patterns you see in the ozone levels.
Read more -
Chapter 4: Problem 31 Stats: Data and Models 4
Problem 31E Test scores Three Statistics classes all took the same test. Histograms and boxplots of the scores for each class are shown below. Match each class with the corresponding boxplot.
Read more -
Chapter 4: Problem 34 Stats: Data and Models 4
Problem 34E Vineyards Here are summary statistics for the sizes (in acres) of Finger Lakes vineyards: Count 36 Mean 46.50 acres StdDev 47.76 Median 33.50 IQR 36.50 Min 6 Q1 18.50 Q3 55 Max 250 a) Would you describe this distribution as symmetric or skewed? Explain. ________________ b) Are there any outliers? Explain. ________________ c) Create a boxplot of these data. ________________ d) Write a few sentences about the sizes of the vineyards.
Read more -
Chapter 4: Problem 33 Stats: Data and Models 4
Graduation? A survey of major universities asked what percentage of incoming freshmen usually graduate “on time” in 4 years. Use the summary statistics given to answer the questions that follow. a) Would you describe this distribution as symmetric or skewed? Explain. b) Are there any outliers? Explain. c) Create a boxplot of these data. d) Write a few sentences about the graduation rates.
Read more -
Chapter 4: Problem 35 Stats: Data and Models 4
Problem 35E Caffeine A student study of the effects of caffeine asked volunteers to take a memory test 2 hours after drinking soda. Some drank caffeine-free cola, some drank regular cola (with caffeine), and others drank a mixture of the two (getting a half-dose of caffeine). Here are the 5-number summaries for each group’s scores (number of items recalled correctly) on the memory test: N Min Q1 Median Q3 Max No Caffeine 15 16 20 21 24 26 Low Caffeine 15 16 18 21 24 27 High Caffeine 15 12 17 19 22 24 a) Describe the W’s for these data. ________________ b) Name the variables and classify each as categorical or quantitative. ________________ c) Create parallel boxplots to display these results as best you can with this information. ________________ d) Write a few sentences comparing the performances of the three groups.
Read more -
Chapter 4: Problem 32 Stats: Data and Models 4
Problem 32E Eye and hair color A survey of 1021 school-age children was conducted by randomly selecting children from several large urban elementary schools. Two of the questions concerned eye and hair color. In the survey, the following codes were used: Hair Color Eye Color 1=Blond 1=Blue 2=Brown 2=Green 3=Black 3=Brown 4=Red 4=Grey 5=Other 5=Other The Statistics students analyzing the data were asked to study the relationship between eye and hair color. They produced this plot: Is their graph appropriate? If so, summarize the findings. If not, explain why not.
Read more -
Chapter 4: Problem 36 Stats: Data and Models 4
Problem 36E SAT scores Here are the summary statistics for Verbal SAT scores for a high school graduating class: n Mean Median SD Min Max Q1 Q3 Male 80 590 600 97.2 310 800 515 650 Female 82 602 625 102.0 360 770 530 680 a) Create parallel boxplots comparing the scores of boys and girls as best you can from the information given. ________________ b) Write a brief report on these results. Be sure to discuss the shape, center, and spread of the scores.
Read more -
Chapter 4: Problem 38 Stats: Data and Models 4
Problem 38E Cholesterol The Framingham Heart Study recorded the cholesterol levels of more than 1400 men. Here is an ogive of the distribution of these cholesterol measures.(An ogive shows the percentage of cases at or below a certain value.) Construct a boxplot for these data, and write a few sentences describing the distribution.
Read more -
Chapter 4: Problem 37 Stats: Data and Models 4
Problem 37E Derby speeds 2014 (Data in Kentucky Derby 2014) How fast do horses run? Kentucky Derby winners top 30 miles per hour, as shown in this graph. The graph shows the percentage of Derby winners that have run slower than each given speed. Note that few have won running less than 33 miles per hour, but about 86% of the winning horses have run less than 37 miles per hour. (A cumulative frequency graph like this is called an “ogive.”) Suppose you had only the ogive (and no access to the data): a) Estimate the median winning speed. b) Estimate the quartiles. c) Estimate the range and the IQR. d) Create a boxplot of these speeds. e) Write a few sentences about the speeds of the Kentucky Derby winners.
Read more -
Chapter 4: Problem 39 Stats: Data and Models 4
Problem 39E Reading scores A class of fourth graders takes a diagnostic reading test, and the scores are reported by reading grade level. The 5-number summaries for the 14 boys and 11 girls are shown: a) Which group had the highest score? b) Which group had the greater range? c) Which group had the greater interquartile range? d) Which group generally did better on the test? Explain. e) If the mean reading level for boys is 4.2 and for girls is 4.6, what is the overall mean for the class?
Read more -
Chapter 4: Problem 40 Stats: Data and Models 4
Problem 40E Cloud seeding In an experiment to determine whether seeding clouds with silver iodide increases rainfall, 52 clouds were randomly assigned to be seeded or not. The amount of rain they generated was then measured (in acre-feet). Here are the summary statistics: a) Which of the summary statistics are most appropriate for describing these distributions. Why? b) Do you see any evidence that seeding clouds may be effective? Explain.
Read more -
Chapter 4: Problem 42 Stats: Data and Models 4
Cholesterol and Smoking A study examining the health risks of smoking measured the cholesterol levels of people who had smoked for at least 25 years and people of similar ages who had smoked for no more than 5 years and then stopped. Create appropriate graphical displays for both groups, and write a brief report comparing their cholesterol levels. Here are the data:
Read more -
Chapter 4: Problem 41 Stats: Data and Models 4
Problem 41E Industrial experiment Engineers at a computer production plant tested two methods for accuracy in drilling holes into a PC board. They tested how fast they could set the drilling machine by running 10 boards at each of two different speeds. To assess the results, they measured the distance (in inches) from the center of a target on the board to the center of the hole. The data and summary statistics are shown in the table: Distance (in.) Speed Distance (in.) Speed 0.000101 Fast 0.000098 Slow 0.000102 Fast 0.000096 Slow 0.000100 Fast 0.000097 Slow 0.000102 Fast 0.000095 Slow 0.000101 Fast 0.000094 Slow 0.000103 Fast 0.000098 Slow 0.000104 Fast 0.000096 Slow 0.000102 Fast 0.975600 Slow 0.000102 Fast 0.000097 Slow 0.000100 Fast 0.000096 Slow Mean 0.000102 Mean 0.097647 StdDev 0.000001 StdDev 0.308481 Write a report summarizing the findings of the experiment. Include appropriate visual and verbal displays of the distributions, and make a recommendation to the engineers if they are most interested in the accuracy of the method.
Read more -
Chapter 4: Problem 43 Stats: Data and Models 4
Problem 43E MPG A consumer organization wants to compare gas mileage figures for several models of cars made in the United States with autos manufactured in other countries. The data for a random sample of cars classified as “midsize” are shown in the table. Gas Mileage (mpg) Country Gas Mileage (mpg) Country 22 U.S. 17 Other 39 U.S. 26 Other 39 U.S. 18 Other 22 U.S. 20 Other 22 U.S. 24 Other 21 U.S. 22 Other 29 U.S. 28 Other 21 U.S. 23 Other 21 U.S. 30 Other 24 U.S. 19 Other 23 U.S. 27 Other 17 U.S. 21 Other 30 U.S. 22 Other 19 U.S. 29 Other 23 U.S. 29 Other 21 U.S. 28 Other 24 U.S. 26 Other 50 Other 21 Other 24 Other 20 Other 35 Other 21 Other a) Create graphical displays for these two groups. ________________ b) Write a few sentences comparing the distributions.
Read more -
Chapter 4: Problem 46 Stats: Data and Models 4
Drunk driving Accidents involving drunk drivers account for a large portion of all deaths on the nation’s highways. The table in the next column tracks the number of alcohol-related fatalities for 31 years. a) Create a stem-and-leaf display or a histogram of these data. b) Create a timeplot. c) Using features apparent in the stem-and-leaf display (or histogram) and the timeplot, write a few sentences about deaths caused by drunk driving.
Read more -
Chapter 4: Problem 44 Stats: Data and Models 4
Problem 44E Baseball 2013 American League baseball teams play their games with the designated hitter rule, meaning that pitchers do not bat. The League believes that replacing the pitcher, typically a weak hitter, with another player in the batting order produces more runs and generates more interest among fans. Following are the average number of runs scored by each team in the 2013 season. a) Create an appropriate graphical display of these data. b) Write a few sentences comparing the average number of runs scored per game in the two leagues. (Remember: shape, center, spread, unusual features!) c) The World Series teams, the Boston Red Sox and St. Louis Cardinals, both were at the top of their respective leagues. Did either team score an unusually large number of runs per game? Explain.
Read more -
Chapter 4: Problem 45 Stats: Data and Models 4
Fruit flies Researchers tracked a population of 1,203,646 fruit flies, counting how many died each day for 171 days. Here are three timeplots offering different views of these data. One shows the number of flies alive on each day, one the number who died that day, and the third the mortality rate—the fraction of the number alive who died. On the last day studied, the last 2 flies died, for a mortality rate of 1.0. a) On approximately what day did the most flies die? b) On what day during the first 100 days did the largest proportion of flies die? c) When did the number of fruit flies alive stop changing very much from day to day?
Read more -
Chapter 4: Problem 47 Stats: Data and Models 4
Problem 47E Assets Here is a histogram of the assets (in millions of dollars) of 79 companies chosen from the Forbes list of the nation’s top corporations: a) What aspect of this distribution makes it difficult to summarize, or to discuss, center and spread? ________________ b) What would you suggest doing with these data if we want to understand them better?
Read more -
Chapter 4: Problem 49 Stats: Data and Models 4
Problem 49E Assets again Here are the same data you saw in Exercise after re-expressions as the square root of assets and the logarithm of assets: a) Which re-expression do you prefer? Why? ________________ b) In the square root re-expression, what does the value 50 actually indicate about the company’s assets? ________________ c) In the logarithm re-expression, what does the value 3 actually indicate about the company’s assets? Exercise Fruit flies Researchers tracked a population of 1,203,646 fruit flies, counting how many died each day for 171 days. Here are three timeplots offering different views of these data. One shows the number of flies alive on each day, one the number who died that day, and the third the mortality rate—the fraction of the number alive who died. On the last day studied, the last 2 flies died, for a mortality rate of 1.0. a) On approximately what day did the most flies die? ________________ b) On what day during the first 100 days did the largest proportion of flies die? ________________ c) When did the number of fruit flies alive stop changing very much from day to day?
Read more -
Chapter 4: Problem 48 Stats: Data and Models 4
Problem 48E Music library Students were asked how many songs they had in their digital music libraries. Here’s a display of the responses: a) What aspect of this distribution makes it difficult to summarize, or to discuss, center and spread? ________________ b) What would you suggest doing with these data if we want to understand them better?
Read more -
Chapter 4: Problem 50 Stats: Data and Models 4
Problem 50E Rainmakers again The table lists the amount of rainfall (in acre-feet) from the 26 clouds seeded with silver Iodide discussed in Exercise: 2745 703 302 242 119 40 7 1697 489 274 200 118 32 4 1656 430 274 198 115 31 978 334 255 129 92 17 a) Why is acre-feet a good way to measure the amount of precipitation produced by cloud seeding? ________________ b) Plot these data, and describe the distribution. ________________ c) Create a re-expression of these data that produces a more advantageous distribution. ________________ d) Explain what your re-expressed scale means. Exercise Rainmakers? In an experiment to determine whether seeding clouds with silver iodide increases rainfall, 52 clouds were randomly assigned to be seeded or not. The amount of rain they generated was then measured (in acre-feet). Here are the summary statistics: n Mean Median SD IQR Q1 Q3 Unseeded 26 164.59 44.20 278.43 138.60 24.40 163 Seeded 26 441.98 221.60 650.79 337.60 92.40 430 a) Which of the summary statistics are most appropriate for describing these distributions? Why? ________________ b) Do you see any evidence that seeding clouds may be effective? Explain.
Read more -
Chapter 4: Problem 51 Stats: Data and Models 4
Problem 51E Stereograms Stereograms appear to be composed entirely of random dots. However, they contain separate images that a viewer can “fuse” into a three-dimensional (3D) image by staring at the dots while defocusing the eyes. An experiment was performed to determine whether knowledge of the embedded image affected the time required for subjects to fuse the images. One group of subjects (group NV) received no information or just verbal information about the shape of the embedded object. A second group (group VV) received both verbal information and visual information (specifically, a drawing of the object). The experimenters measured how many seconds it took for the subject to report that he or she saw the 3D image. a) What two variables are discussed in this description? b) For each variable, is it quantitative or categorical? If quantitative, what are the units? c) The boxplots compare the fusion times for the two treatment groups. Write a few sentences comparing these distributions. What does the experiment show?
Read more -
Chapter 4: Problem 52 Stats: Data and Models 4
Stereograms, revisited Because of the skewness of the distributions of fusion times described in Exercise 51, we might consider a re-expression. Here are the boxplots of the log of fusion times. Is it better to analyze the original fusion times or the log fusion times? Explain.
Read more -
Chapter 4: Problem 1 Stats: Data and Models 4
Problem 1E Load factors, 2013 The Research and Innovative Technology Administration of the Bureau of Transportation Statistics (www.TranStats.bts.gov /Data_Elements.aspx?Data=2) reports load factors (passenger-miles as a percentage of available seat-miles) for commercial airlines for every month from 2000 through September 2013. Here are histograms comparing the domestic and international load factors for this time period:
Read more -
Chapter 4: Problem 3 Stats: Data and Models 4
Load factors 2013 by month Here is a display of the international load factors by month for the period from 2000 to 2013. Discuss the patterns you see in this display.
Read more -
Chapter 4: Problem 4 Stats: Data and Models 4
Load factors 2013 by year Here is a display of the domestic load factors by year. Discuss the patterns you see in this display.
Read more -
Chapter 4: Problem 2 Stats: Data and Models 4
Problem 2E Load factors, 2013 by season We can also compare domestic load factors for September through March versus those for April through August: Compare and contrast what these histograms show.
Read more -
Chapter 4: Problem 6 Stats: Data and Models 4
Problem 6E Extraordinary months again Here’s a boxplot of all of the domestic load factors. It shows a single outlier. The boxplots of Exercise 4 show the same data, but have no outliers. Why do you think this is? Exercise 4: Load factors 2013 by year Here is a display of the domestic load factors by year. Discuss the patterns you see in this display.
Read more -
Chapter 4: Problem 7 Stats: Data and Models 4
Load factors 2013 over time Here is a timeplot of each monthly load factor for domestic flights for 2000 to 2013 along with a lowess smooth. a) Describe the patterns you see in this plot. b) Do you expect the overall pattern to continue for another decade? Why or why not?
Read more -
Chapter 4: Problem 5 Stats: Data and Models 4
Extraordinary months Look at the boxplots by month in Exercise 3. The three outliers in September, October, and November are all from the year 2001 and reflect the terrorist attacks of 9/11. Do you think the data for these months should be set aside in any overall analysis of load factor patterns by month? Explain.
Read more -
Chapter 4: Problem 8 Stats: Data and Models 4
Problem 8E Load factors 2013 over time, a second look Here is a timeplot of the same domestic load factors as in Exercise 7, but this time with a different smoother (called a median smoother) applied. a) What patterns do you see in this plot? b) Do you expect the patterns you see here to continue for the next decade? Why or why not? Exercise 7: Load factors 2013 over time Here is a timeplot of each monthly load factor for domestic flights for 2000 to 2013 along with a lowess smooth. a) Describe the patterns you see in this plot. b) Do you expect the overall pattern to continue for another decade? Why or why not?
Read more -
Chapter 4: Problem 9 Stats: Data and Models 4
Problem 9E Exoplanets Discoveries of planets beyond our solar system have grown rapidly. Here is a histogram showing the distance (in light-years) from earth to stars having known planets (as of 2014). Explain why it might be beneficial to re-express these distances.
Read more -
Chapter 4: Problem 10 Stats: Data and Models 4
Problem 10E Exoplanets re-expressed Here are the exoplanet distances of Exercise 9, re-expressed to the log scale. a) Is this a better scale to understand these distances? b) The low outlier is “sol”– that is, it is the distance of the sun from the earth. Do you think it belongs with these data? Exercise 9: Exoplanets Discoveries of planets beyond our solar system have grown rapidly. Here is a histogram showing the distance (in light-years) from earth to stars having known planets (as of 2014). Explain why it might be beneficial to re-express these distances.
Read more -
Chapter 4: Problem 15 Stats: Data and Models 4
Problem 15E Pizza prices A company that sells frozen pizza to stores in four markets in the United States (Denver, Baltimore, Dallas, and Chicago) wants to examine the prices that the stores charge for pizza slices. Here are boxplots comparing data from a sample of stores in each market: a) Do prices appear to be the same in the four markets? Explain. ________________ b) Does the presence of any outliers affect your overall conclusions about prices in the four markets?
Read more -
Chapter 4: Problem 17 Stats: Data and Models 4
Problem 17E Rock concert accidents Crowd Management Strategies (www.crowdsafe.com) monitors accidents at rock concerts. In their database, they list the names and other variables of victims whose deaths were attributed to “crowd crush” at rock concerts. Here are the histogram and boxplot of the victims’ ages for data from a recent one-year period. a) What features of the distribution can you see in both the histogram and the boxplot? b) What features of the distribution can you see in the histogram that you could not see in the boxplot? c) What summary statistic would you choose to summarize the center of this distribution? Why? d) What summary statistic would you choose to summarize the spread of this distribution? Why?
Read more -
Chapter 4: Problem 18 Stats: Data and Models 4
Problem 18E Slalom times 2010 The Men’s Giant Slalom skiing event consists of two runs whose times are added together for a final score. Two displays of the giant slalom times in the 2010 Winter Olympics are shown below. a) What features of the distribution can you see in both the histogram and the boxplot? b) What summary statistic would you choose to summarize the center of this distribution? Why? c) What summary statistic would you choose to summarize the spread of this distribution? Why?
Read more -
Chapter 4: Problem 21 Stats: Data and Models 4
Problem 21E Population growth 2010 by region On the next page is a “back-to-back” stem-and-leaf display that shows two data sets at once—one going to the left, one to the right. The display compares the percent change in population for two regions of the United States (based on census figures for 2000 and 2010). The fastest growing state was Nevada at 35%. To show the distributions better, this display breaks each stem into two lines, putting leaves 0–4 on one stem and leaves 5–9 on the other. a) Use the data displayed in the stem-and-leaf display to construct comparative boxplots. b) Write a few sentences describing the difference in growth rates for the two regions of the United States.
Read more -
Chapter 4: Problem 19 Stats: Data and Models 4
Problem 19E Cereals Sugar is a major ingredient in many breakfast cereals. The histogram displays the sugar content as a percentage of weight for 49 brands of cereal. The boxplot compares sugar content for adult and children’s cereals. a) What is the range of the sugar contents of these cereals? ________________ b) Describe the shape of the distribution. ________________ c) What aspect of breakfast cereals might account for this shape? ________________ d) Are all children’s cereals higher in sugar than adult cereals? ________________ e) Which group of cereals varies more in sugar content? Explain.
Read more -
Chapter 4: Problem 22 Stats: Data and Models 4
Camp sites Shown below are the histogram and summary statistics for the number of camp sites at public parks in Vermont. a) Which statistics would you use to identify the center and spread of this distribution? Why? b) How many parks would you classify as outliers? Explain. c) Create a boxplot for these data. d) Write a few sentences describing the distribution.
Read more -
Chapter 4: Problem 16 Stats: Data and Models 4
Costs To help travelers know what to expect, researchers collected the prices of commodities in 16 cities throughout the world. Here are boxplots comparing the prices of a ride on public transportation, a newspaper, and a cup of coffee in the 16 cities (prices are all in US$). a) On average, which commodity is the most expensive? b) Is a newspaper always more expensive than a ride on public transportation? Explain. c) Does the presence of outliers affect your conclusions in part a or b?
Read more -
Chapter 4: Problem 23 Stats: Data and Models 4
Hospital stays The U.S. National Center for Health Statistics compiles data on the length of stay by patients in short-term hospitals and publishes its findings in Vital and Health Statistics. Data from a sample of 39 male patients and 35 female patients on length of stay (in days) are displayed in the following histograms. a) What would you change about these histograms to make them easier to compare? b) Describe these distributions by writing a few sentences comparing the duration of hospitalization for men and women. c) Can you suggest a reason for the peak in women’s length of stay?
Read more -
Chapter 4: Problem 24 Stats: Data and Models 4
Problem 24E Deaths 2011 A National Vital Statistics Report (www.cdc.gov/nchs/) indicated that nearly 290,000 black Americans died in 2011, compared with just over 2 million white Americans. Below are histograms displaying the distributions of their ages at death. a) Describe the overall shapes of these distributions. b) How do the distributions differ? c) Look carefully at the bar definitions. Where do these plots violate the rules for statistical graphs?
Read more -
Chapter 4: Problem 20 Stats: Data and Models 4
Problem 20E Tendon transfers People with spinal cord injuries may lose function in some, but not all, of their muscles. The ability to push oneself up is particularly important for shifting position when seated and for transferring into and out of wheelchairs. Surgeons compared two operations to restore the ability to push up in children. The histogram shows scores rating pushing strength two years after surgery and boxplots compare results for the two surgical methods. (Mulcahey, Lutz, Kozen, Betz, “Prospective Evaluation of Biceps to Triceps and Deltoid to Triceps for Elbow Extension in Tetraplegia,” Journal of Hand Surgery, 28, 6, 2003) a) Describe the shape of the strength distribution. ________________ b) What is the range of the strength scores? ________________ c) What fact about results of the two procedures is hidden in the histogram? ________________ d) Which method had the higher (better) median score? ________________ e) Was that method always best? ________________ f) Which method produced the most consistent results? Explain.
Read more -
Chapter 4: Problem 25 Stats: Data and Models 4
Women’s basketball Here are boxplots of the points scored during the first 10 games of the season for both Scyrine and Alexandra: a) Summarize the similarities and differences in their performance so far. b) The coach can take only one player to the state championship. Which one should she take? Why?
Read more