Solution Found!
SAT scores The SAT is a test often used as part of an
Chapter 6, Problem 53E(choose chapter or problem)
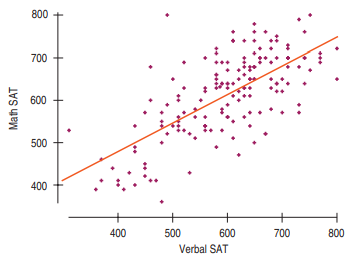
SAT scores The SAT is a test often used as part of an application to college. SAT scores are between 200 and 800, but have no units. Tests are given in both Math and Verbal areas. SAT-Math problems require the ability to read and understand the questions, but can a person’s verbal score be used to predict the math score? Verbal and math SAT scores of a high school graduating class are displayed in the scatterplot, with the regression line added.
a) Describe the relationship.
b) Are there any students whose scores do not seem to fit the overall pattern?
c) For these data, r = 0.685. Interpret this statistic.
d) These verbal scores averaged 596.3, with a standard deviation of 99.5, and the math scores averaged 612.2, with a standard deviation of 96.1. Write the equation of the regression line.
e) Interpret the slope of this line.
f) Predict the math score of a student with a verbal score of 500.
g) Every year, some students score a perfect 1600. Based on this model, what would such a student’s residual be for her math score?
Questions & Answers
QUESTION:
SAT scores The SAT is a test often used as part of an application to college. SAT scores are between 200 and 800, but have no units. Tests are given in both Math and Verbal areas. SAT-Math problems require the ability to read and understand the questions, but can a person’s verbal score be used to predict the math score? Verbal and math SAT scores of a high school graduating class are displayed in the scatterplot, with the regression line added.
a) Describe the relationship.
b) Are there any students whose scores do not seem to fit the overall pattern?
c) For these data, r = 0.685. Interpret this statistic.
d) These verbal scores averaged 596.3, with a standard deviation of 99.5, and the math scores averaged 612.2, with a standard deviation of 96.1. Write the equation of the regression line.
e) Interpret the slope of this line.
f) Predict the math score of a student with a verbal score of 500.
g) Every year, some students score a perfect 1600. Based on this model, what would such a student’s residual be for her math score?
ANSWER:Step 1 of 8
The scatter plot and regression line for Math SAT score and Verbal SAT score is given below:
